CEW introduced its first try at calculating college ROI in 2019. Did they get it right?
Read on to find out.
“There are a few great orchestras in the world, thank goodness. Although some people do put them in ranking order, it’s not like a snooker match. Each orchestra has different things to offer.”
Simon Rattle
Introduction to the CEW and their “First Try At ROI”
The Georgetown University Center on Education and the Workforce (CEW) is a renowned institution in education and workforce studies, widely recognized for producing influential research.
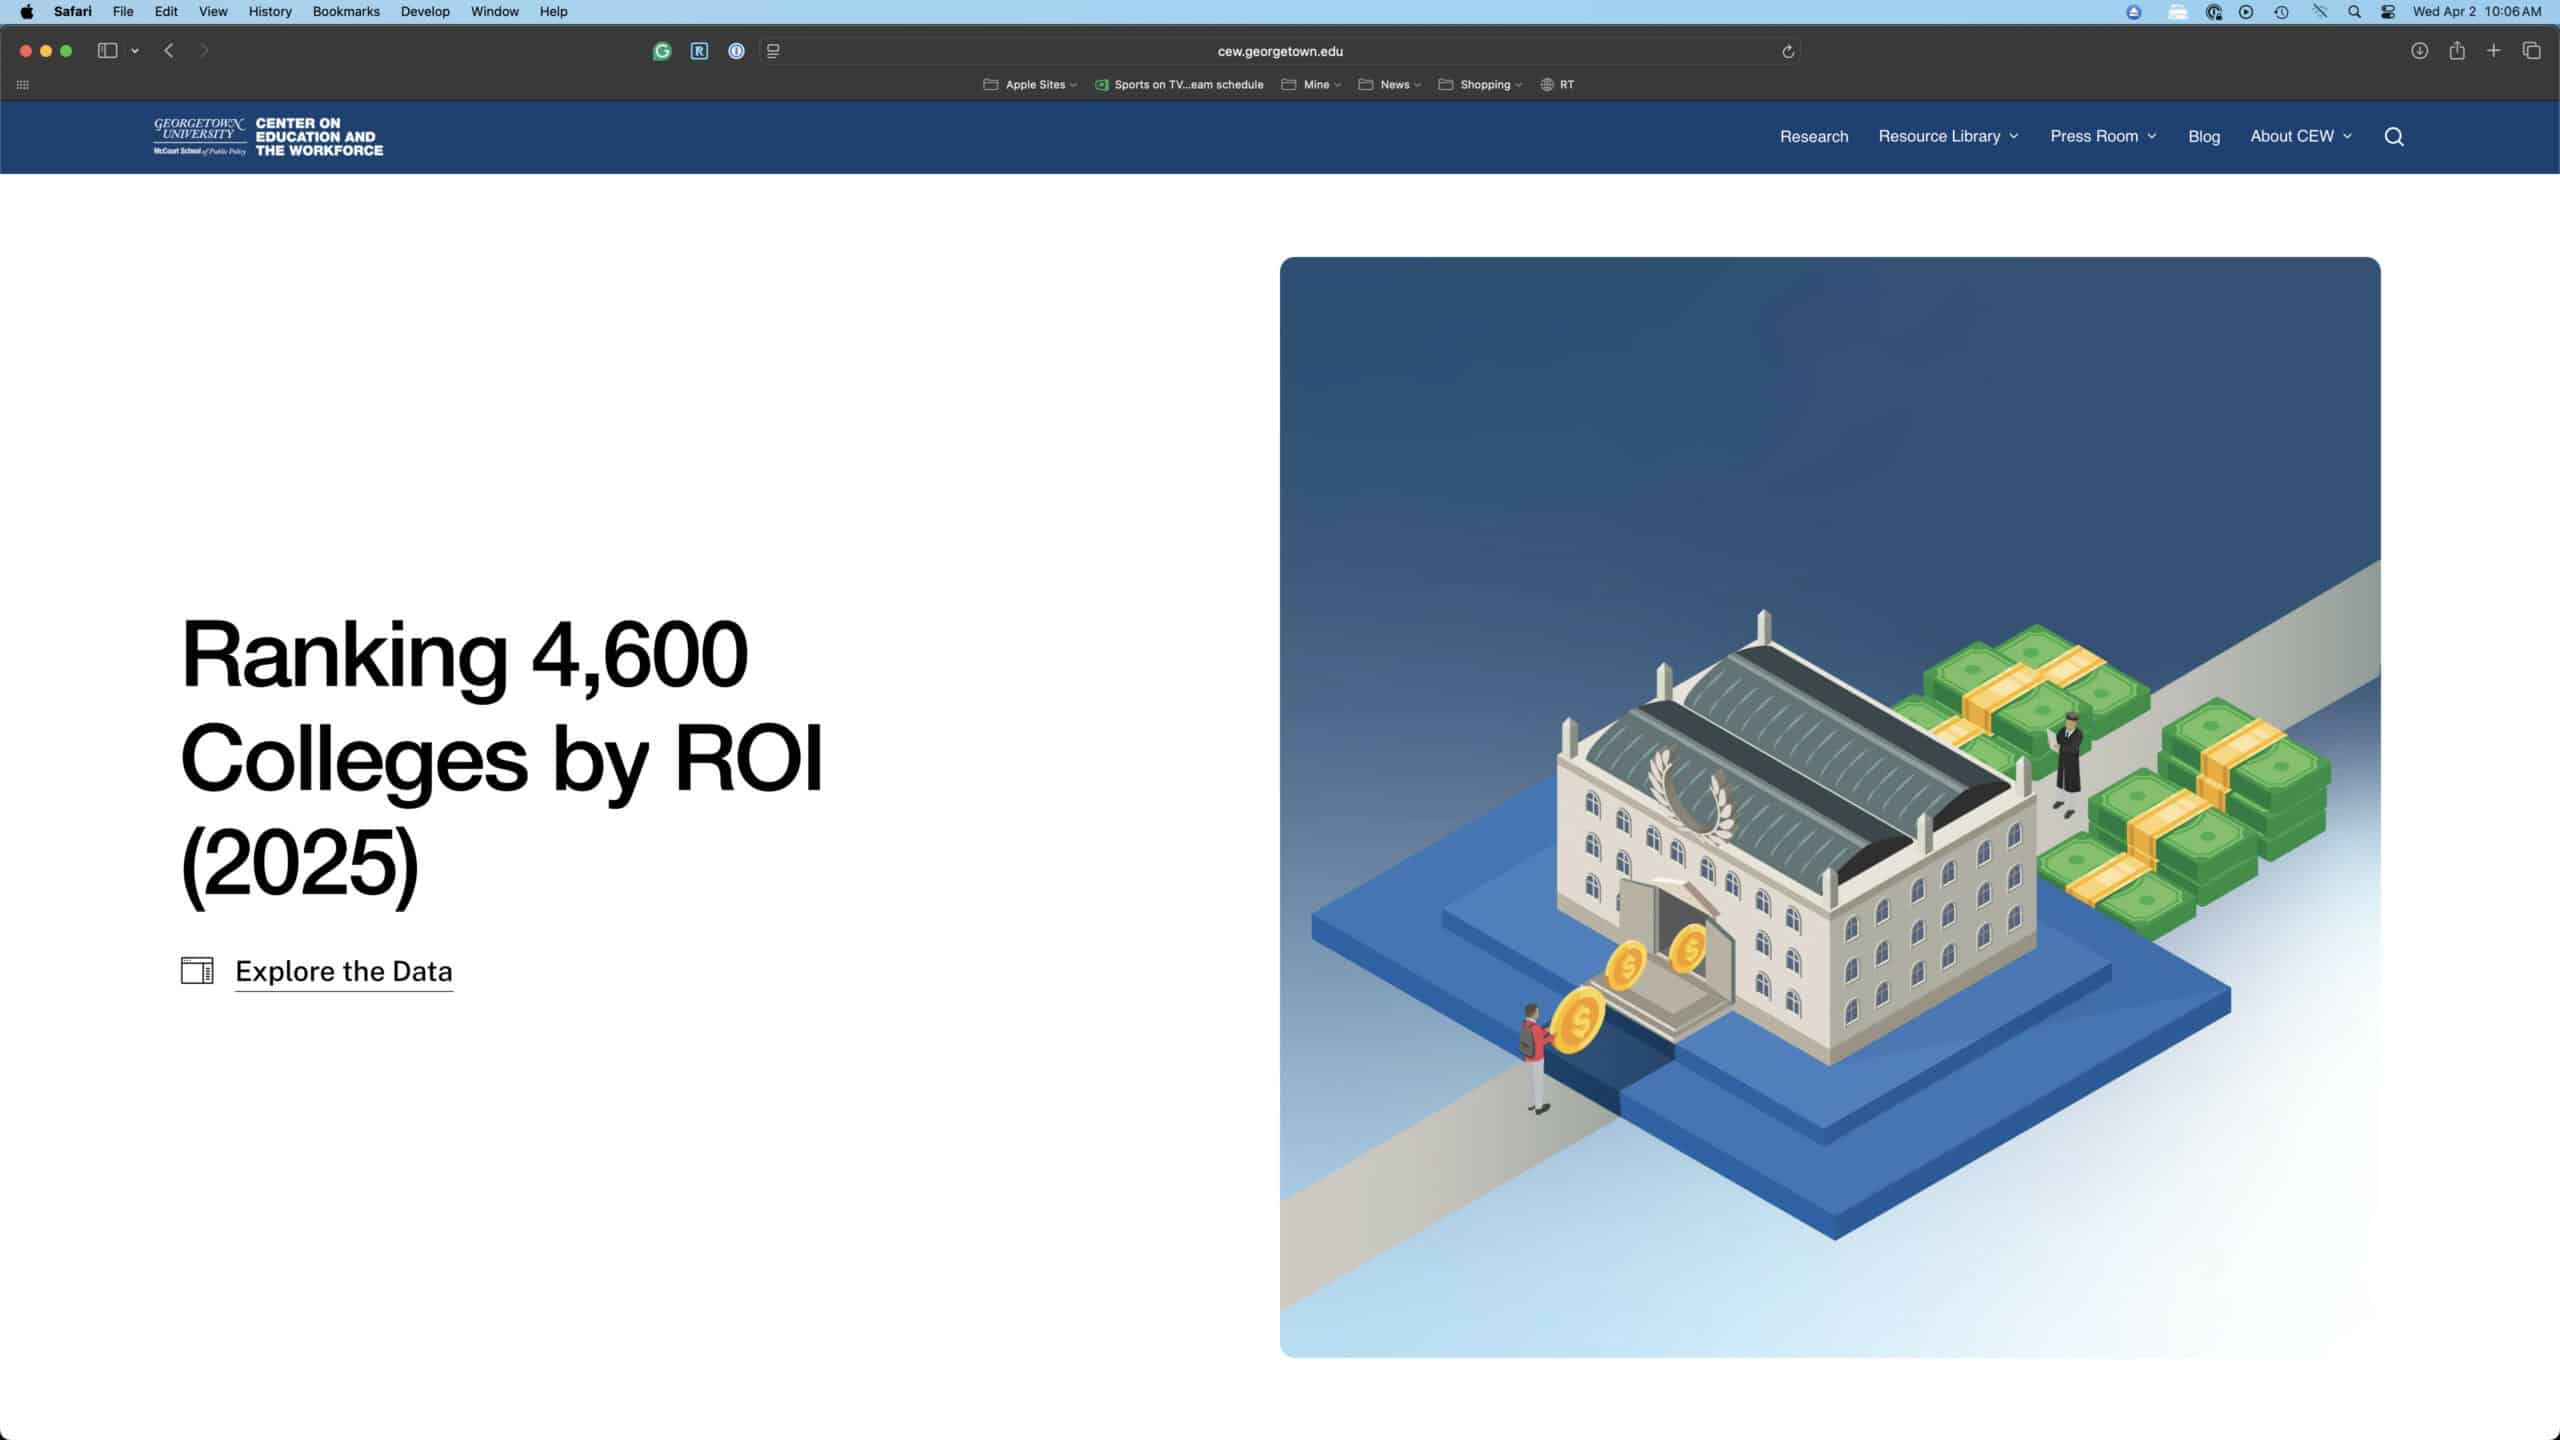
Their 2011 report, ‘The College Payoff: Education, Occupations, Lifetime Earnings,’ is substantial and authoritative, making it a crucial resource for anyone interested in the economic value of college education. 1
Since its publication in 2011, the report has been a reliable source for evaluations of the college wage premium, consistently cited over the years. 2
The report’s initial findings, which established the lifetime earnings of a bachelor’s graduate at $2.8 million and a high school graduate at $1.6 million, have profoundly shaped the conversation around college degrees. The notion that a college graduate earns $1.2 million more than a high school graduate has been a pivotal argument underpinning the value of college degrees.
In 2019, the CEW published its First Try At ROI: Ranking 4,500 Colleges. It has also been updated with new data in 2022: Ranking 4,500 Colleges by ROI (2022). 3
The methodology is the same for both, with the 2022 offering updated figures for each school’s income and cost and a recalculation of their respective ROI.
In the report introduction, they say: “As college costs and student loan debt continue to rise precipitously, more people are wondering if College is worth it. Based on earnings alone, yes, it is. On average, workers with a bachelor’s degree make 80 percent more than workers with no more than a high school diploma. At the same time, the potential benefits, as well as the costs, vary notably by institution, program, and field of study, and students should be informed about the potential costs and benefits of their choices.“
The CEW strongly believes in the value of college education, stating in their report introduction, “Our findings buttress the idea that College is a worthwhile investment. Moreover, we take the position that College should be seen as a long-term investment.”
This perspective, which emphasizes the long-term financial benefits of a college degree, is a crucial driver of their research and report findings.
"Our findings buttress the idea that College is a worthwhile investment. Moreover, we take the position that College should be seen as a long-term investment.”

A First Try At ROI: Ranking 4,500 Colleges (2019)
What the CEW fixed (versus their College Payoff Report)
The new report, published in 2022, is a commendable effort to address some criticisms about the design assumptions used in the previous report. Most notably, the CEW factors in the cost of earning a degree and attempts to reflect the time value of money. These changes represent a significant improvement over the 2011 report, which did not consider these factors.
The CEW calculates earnings for each College using the same data we use in our model. However, their methodology is more complex than ours, and they assume flat earnings beyond ten years after enrollment.
This assumption may lead to an understatement of lifetime earnings and their NPV.
We do not have a significant quibble with this specific assumption or their approach to creating a synthetic lifetime earnings projection for consistent comparison. Understanding these assumptions and their implications is essential when interpreting the report’s findings.
They calculate a net present value of earnings after costs, their basis for comparing colleges. In their report, “The median net present value for all colleges is $723,000 in the long term (40 years after enrollment), but only $107,000 in the short term (10 years after enrollment).”
This is a good start in the right direction. However, several methodological flaws persist despite these advancements, as we explore below.
Where could the CEW improve?
In evaluating college degrees using the college wage premium, the CEW makes five study assumptions that need consideration:
- Inconsistent comparison periods (ages 24-64, then 18-58 versus 18-65).
- Assume flat attendance costs, excluding inflation.
- Ignoring the impact of taxes on earnings.
- Their time value of money is low, and they do not reflect the risk of the investment correctly.
- They are inconsistent in using a benchmark for comparing colleges, ignoring their prior research.
Let’s explore each in more detail.
Inconsistent comparison periods
CEW’s previous College Payoff report tracked earnings from age 24 to 64, spanning 40 years. This report shifts to 40 years, starting at enrollment (typically age 18) and ending at age 58. While this aligns earnings with the education decision, it excludes seven years (ages 58-65), when college graduates’ median earnings often peak.
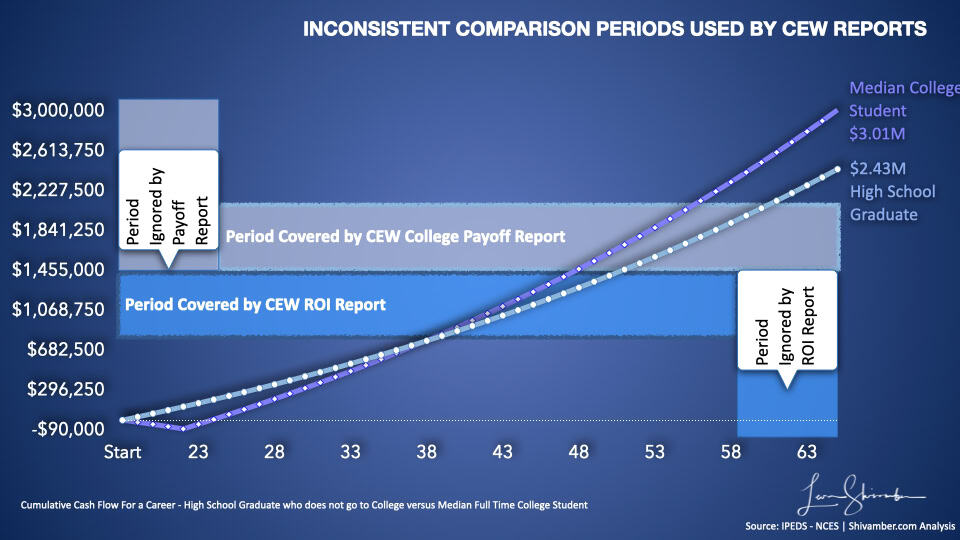
Extending the horizon to age 65 could increase the NPV for high-earning fields, such as engineering or medicine, where late-career earnings are substantial. Thus, college’s lifetime value is underrepresented. We recommend using ages 18 to 65.
Assuming Flat Costs
In its notes, the CEW acknowledges, “We also assume no increases in the cost of postsecondary investment, including tuition. This assumption matters less at long horizons but would overestimate the economic value in the short term if costs are actually increasing.“
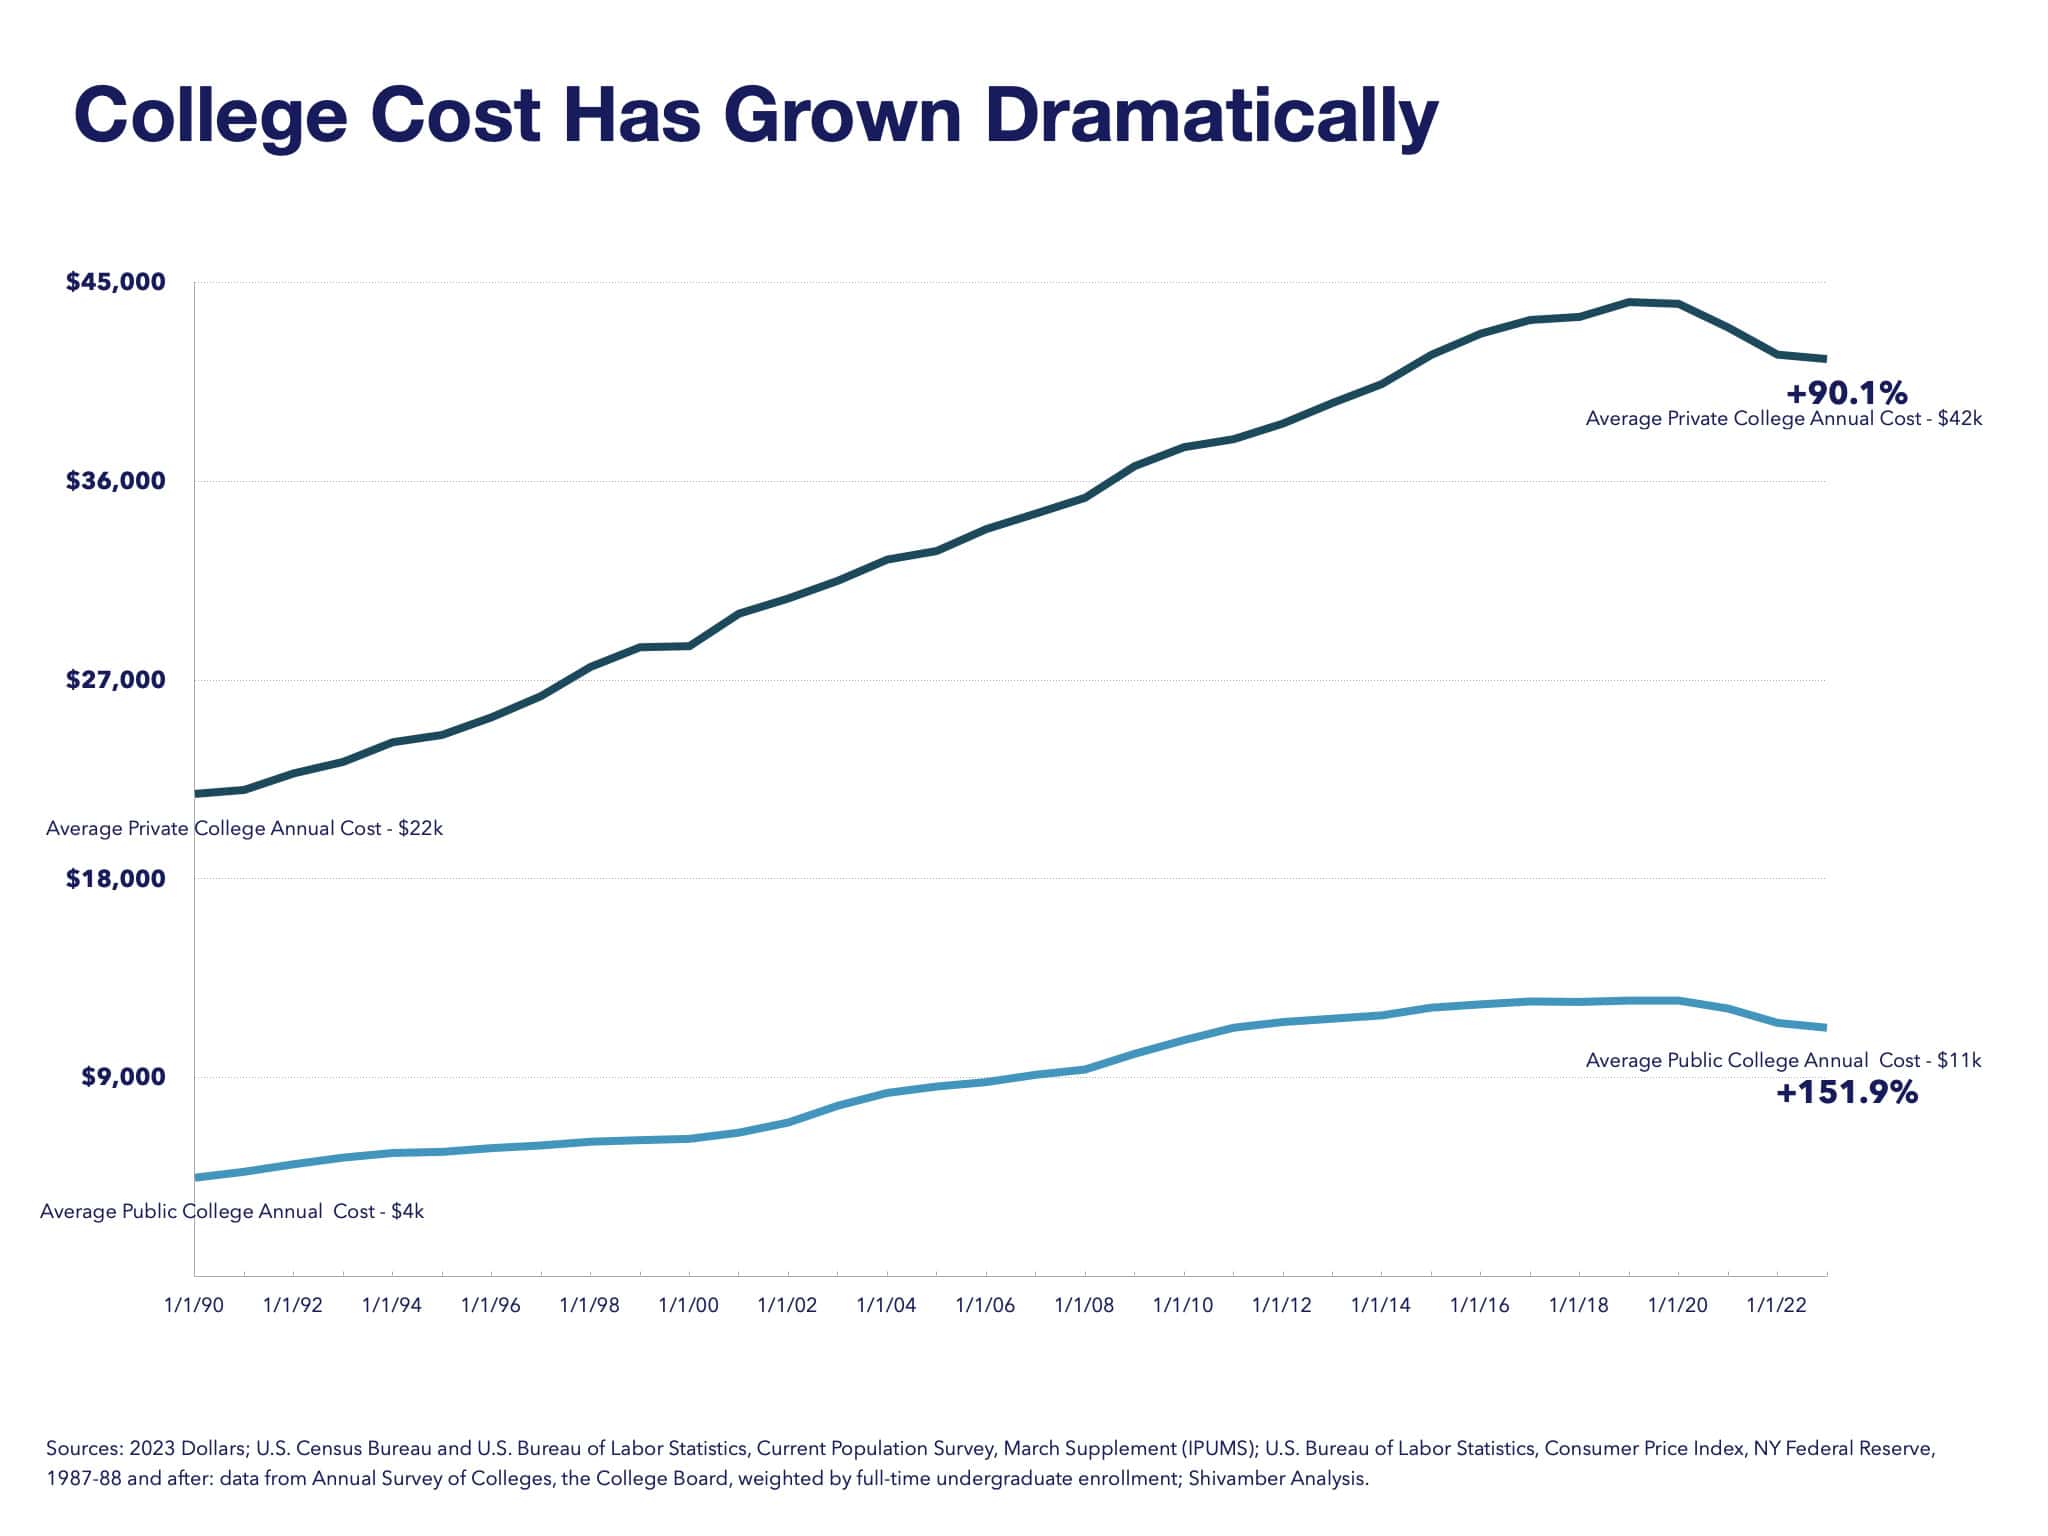
Historically, college costs have outpaced inflation. For example, tuition costs have increased between 90% and 150% since 1990 after adjusting for inflation. Costs only appear to have come down recently due to higher inflation rates.
The CEW assumes static costs, simplifies calculations, and is applied consistently across institutions. However, for students facing annual increases, this overstates short-term ROI.
This design assumption is not a significant quibble as they have applied it consistently. However, in the interest of accuracy, it is worth correcting.
Ignoring The Impact of Taxes
Our federal tax system is progressive, taxing higher incomes at a higher rate. Further, we pay college costs with after-tax dollars, and tax deductibility is limited in value and timing.
The CEW calculates NPV using pre-tax earnings, overlooking the tax burden’s effect on net benefits. For example, in our model, a high school graduate pays $400,000 in taxes over their lifetime. In contrast, a college graduate will pay $600,000. This $200,000 difference reduces the after-tax NPV advantage of college by 20-25%, narrowing the gap in the CEW’s rankings, especially for mid-tier institutions.
The best measure of ROI is the Net Present Value of Lifetime earnings after taxes and costs.
Ignoring or Using Low Time Value of Money Rate
The time value of money is the principle that a dollar today is worth more than a dollar in the future due to its potential to earn interest. For instance, the money spent on college upfront could have been invested elsewhere.
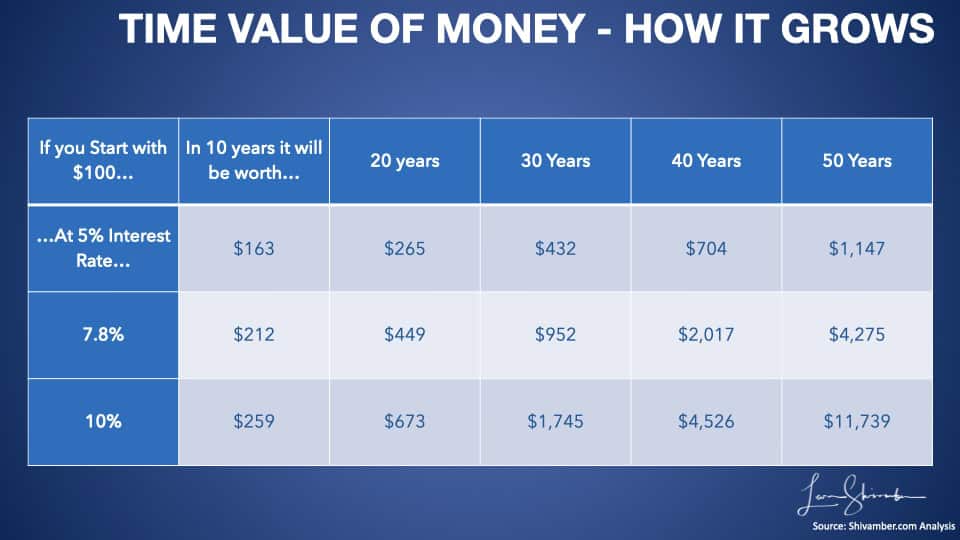
Conversely, this principle means that earnings years later are worth less than today’s dollars.
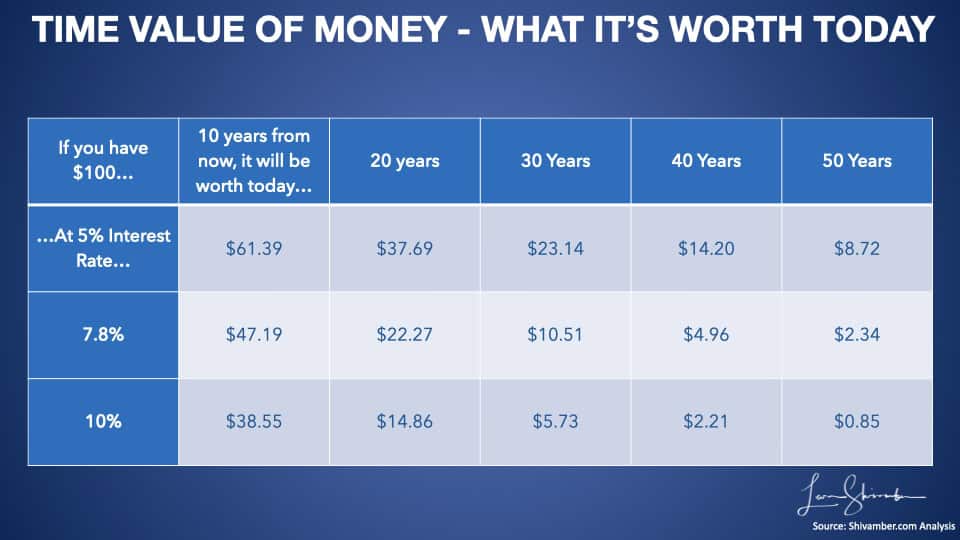
By not discounting future earnings and costs to their present value, CEW overstates the economic return of college.
This omission is critical for any investment analysis in which investments are made upfront, and the benefits accrue over an extended period.
In its technical appendix to the College Payoff, the CEW acknowledges criticism about its approach, which ignores the time value of money. They argue that including the time value would not have changed their conclusion on college value.
They use an example to argue why their conclusion does not change. They choose a discount rate of 2.5% because this represents the real interest rate of long-term government bonds. In our critique of that report, we have argued that this discount is well below what is required to evaluate a risky investment.
In this ROI report, they chose an even lower interest rate of 2%.
They explain this choice by stating: “We make the assumption that the person is risk averse and will compare returns to the yield of a safe investment, such as US Treasury securities, which currently have a long-term return of approximately 2 percent. We use a 2 percent discount rate since we cannot assume that someone is willing to trade off the higher risk of investing in the stock.’ This use of a discount rate is a standard financial practice that allows for the comparison of future earnings to their present value.”
We have several issues with their choices.
Why did they choose a lower rate of 2% here when they used the higher 2.5% previously?
In the notes, they acknowledge: “Avery and Turner (2012) use 3 percent, while other studies use discount rates of 5 percent or higher. For a review, see Barrow and Malamud’s “Is College a Worthwhile Investment?” 2015.”
They also say, “The choice of discount rate can depend on the perspective of the analyst. For example, if an analyst was a policy maker interested in the costs and benefits of using loans to subsidize higher education, then a higher discount rate might be applicable. In this case, the analyst would consider the costs of administering the federal loan program instead of the individual net price of institutions. Analysts might also use a higher interest rate if they perceived that the cash flows are highly risky.“
Their 2% discount rate choice belies the view that higher discount rates are applicable for lengthy and risky investments. The current government funding rate is 5.4%, while Parent Plus student loans are 8.05%. Investments of this nature typically require discount rates ranging from 12 to 20%.
The New York Federal Reserve used 5% in their study published in September 2014. 4
The San Francisco Federal Reserve says: “Because the costs of college are paid today but the benefits accrue over many future years when a dollar earned will be worth less, we discount future earnings by 6.67%, which is the average rate on an AAA bond from 1990 to 2011.”5
The CBO projection of current Subsidized and Unsubsidized Loans to Undergraduate Students for 23-24 is 5.91%. For PLUS Loans to Graduate Students and Parents, that projection is 8.46%. 6
With their most recent 2025 ROI analysis (2025), they have reverted to ignoring the time value of money. They say, “By doing away with the discount rate, we are attempting to eliminate subjectivity by treating future earnings the same as current earnings.”7
The CEW ignores a basic principle required when evaluating investments: the time value of money. A higher discount rate would better reflect the risk, leading to a steeper reduction in NPV and favoring lower-cost institutions.
Inconsistent Benchmark Comparisons
The CEW says: “Even though we rank the net present value for all colleges with available data, we exclude from these rankings an important benchmark: the alternative to not investing in postsecondary education. This benchmark varies depending on circumstances. For example, instead of attending College, a potential student might choose to participate in the labor force with just a high school diploma and earn $15,000 a year.“
The notes add: “This annual earnings amount is close to the federal minimum wage at $7.25 per hour for 2,000 hours per year. The 40-year net present value for this stream of earnings is $397,000, while at a 10-year horizon, the net present value is $130,000. At $10 per hour, the 10-year net present value is $180,000, while the 40-year net present value is $547,000.”
Why did they choose abstract earnings estimates here when they had previously calculated high school graduate earnings to show the $1.2 million premium over the lifetime? This arbitrary shift exaggerates college value and undermines comparability across CEW studies.
According to the previous report: “Thus, the $2,789,000 lifetime earnings of a Bachelor’s degree holder has a current lump sum value of $1,712,000, which is 39 percent less than the simple adding up of yearly earnings. Using discounted values, the dollar gap between Bachelor’s degree holders and high school graduates falls to $786,000 (from nearly $1.3 million).”
Their analysis implies that the Net Present Value of a High School Graduate’s earnings is approximately $924k ($1,712 minus $786k) when using the 2.5% discount rate used previously.
At the very least, the comparable benchmark for not investing in a postsecondary institution, i.e., leaving high school and going to work, is their $924k.
Comparing CEW Benchmarks:
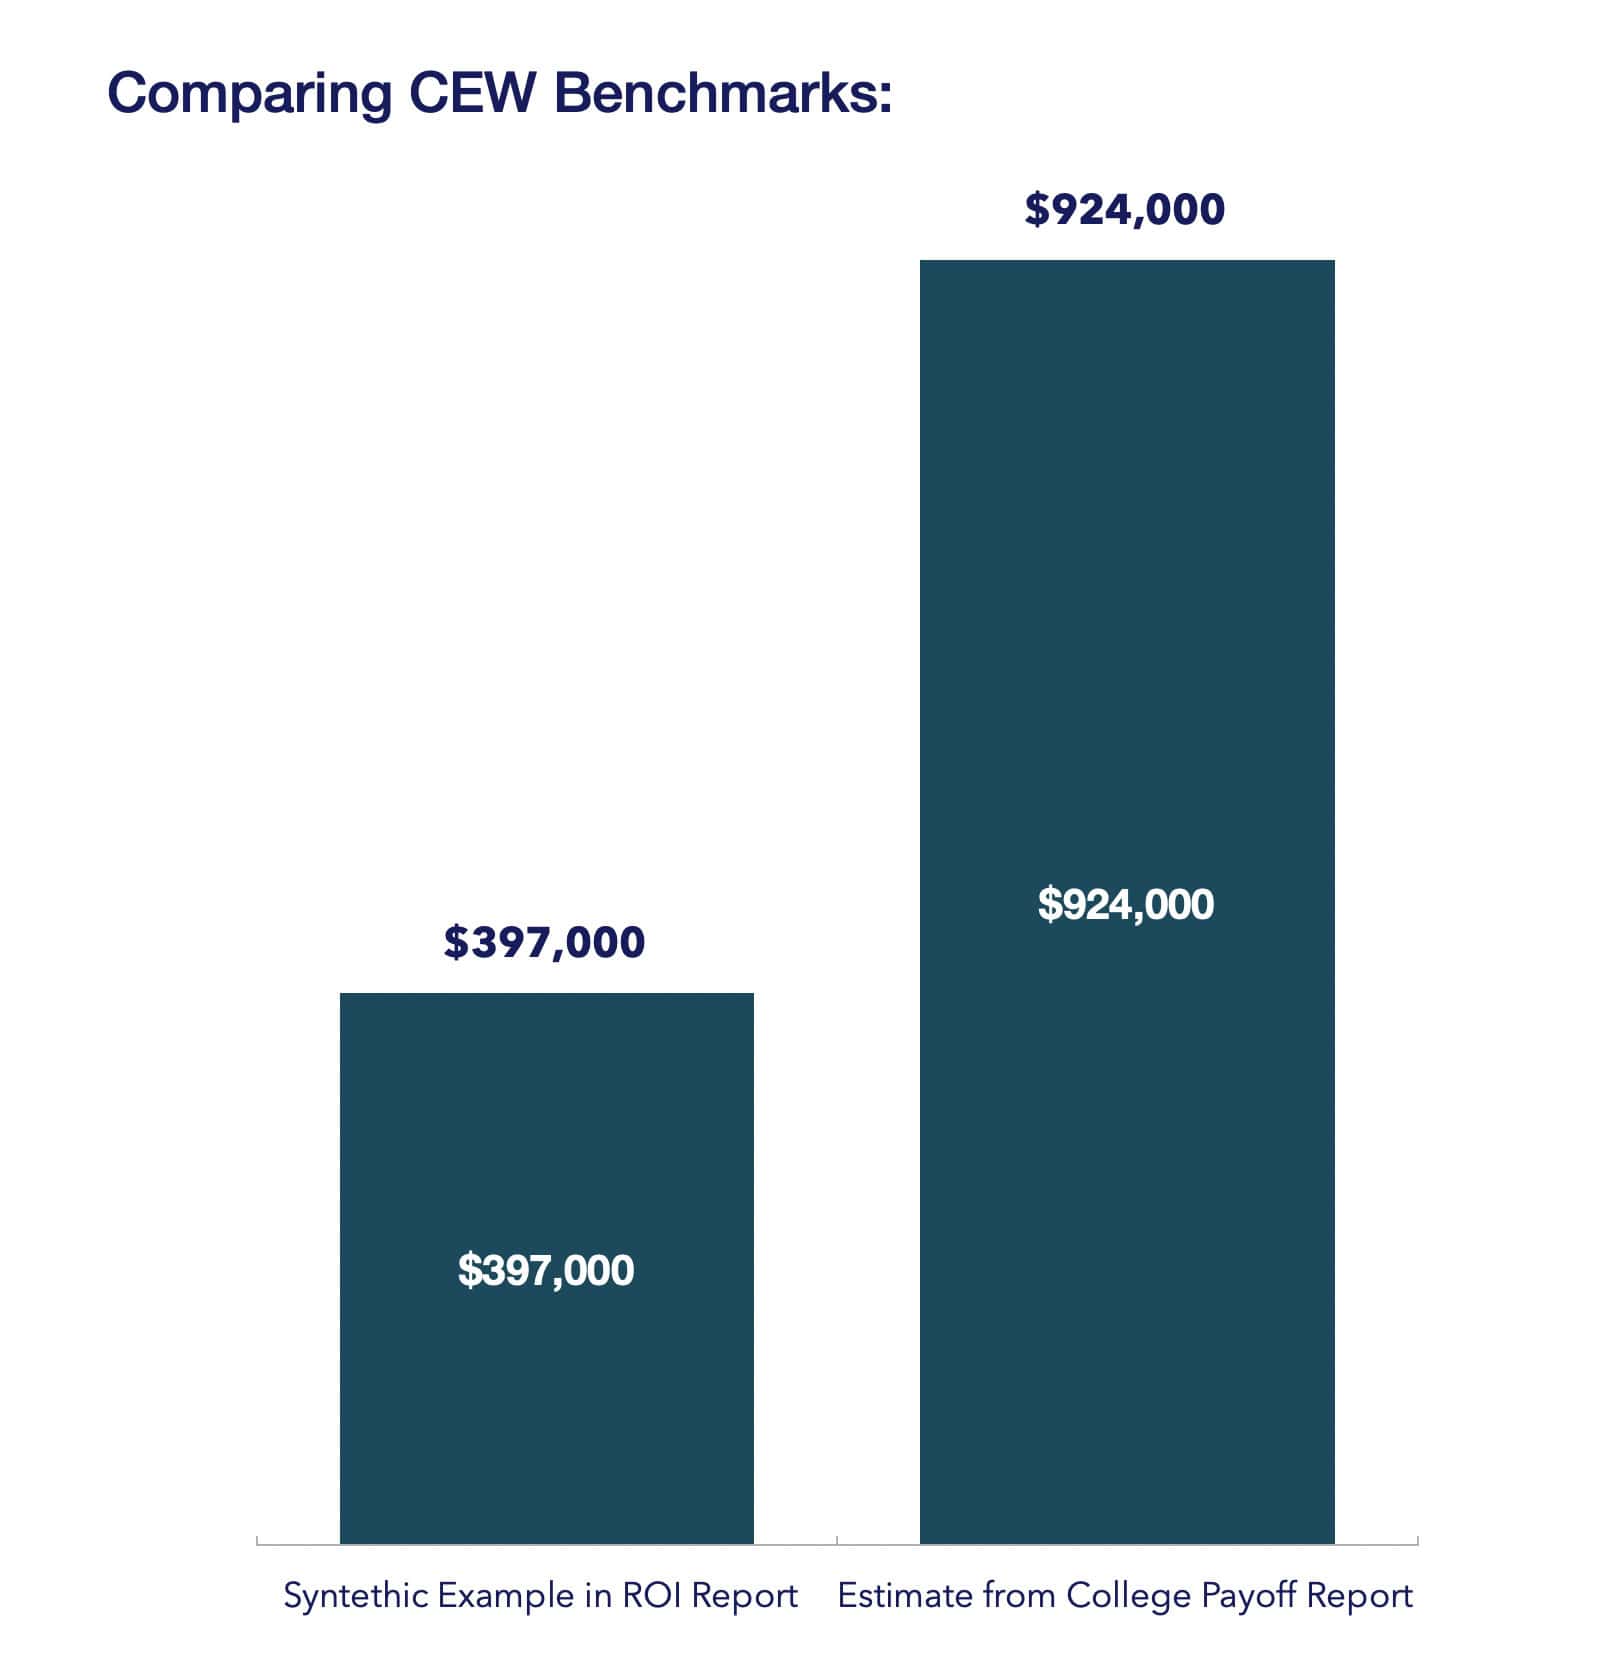
The CEW ROI ranking reaches the exact wrong conclusion.
The authors of the ‘ROI Ranking’ report made some progress in responding to individual criticisms. However, several essential omissions/assumptions need to be revised to ensure the robustness of their findings and the validity of their conclusions.
The CEW would have done well considering all the criticisms and determining whether their conclusion holds up.
We feel the new ROI methodology fails to withstand comprehensive scrutiny.
The ROI report shows a 40-year NPV for 4,383 institutions ranging from $2,680k to $291k.
Using an approximate $924k Net Present Value of High School Graduates, only 1,542 (35%) of their listed institutions generated a higher NPV. That means 65% of their Institutions deliver a return lower than the High School Graduate Benchmark!
Reference Sources
- Anthony P. Carnevale, Ban Cheah, and Emma Wenzinger. The College Payoff: More Education Doesn’t Always Mean More Earnings. Georgetown University Center on Education and the Workforce, 2021. cew.georgetown.edu/ collegepayoff2021.
- Carnevale, A. P., Cheah, B., & Rose, S. J. (2011). The College Payoff. Georgetown University Center on Education and the Workforce, 2011 cew.georgetown.edu/
- Georgetown University Center on Education and the Workforce, A First Try at ROI: Ranking 4,500 Colleges, 2020. & Ranking 4,500 Colleges by ROI (2022) https://cew.georgetown.edu/cew-reports/roi2022/
- Abel, Jason R., and Richard Deitz. “The Value of a College Degree.” Liberty Street Economics. Federal Reserve Bank of New York, September 2, 2014. https://libertystreeteconomics.newyorkfed.org/2014/09/the-value-of-a-college-degree/.
- Daly, Mary C. “Is It Still Worth Going To College?” Research & Insights Economic Letter, no. 2014-13. Accessed July 14, 2024. https://www.frbsf.org/research-and-insights/publications/economic-letter/2014/05/is-college-worth-it-education-tuition-wages/.
- Congressional Budget Office. ”Baseline Projections Federal Student Loan Programs.” Cbo.Gov. Accessed July 14, 2024. https://www.cbo.gov/system/files/2023-05/51310-2023-05-studentloan.pdf.
- Ban Cheah, Martin Van Der Werf, Catherine Morris and Jeff Strohl. Ranking 4,600 Colleges by ROI (2025). Georgetown University Center on Education and the Workforce, 2025. https://cew.georgetown.edu/wp-content/uploads/cew-college_roi_faqs-2025.pdf