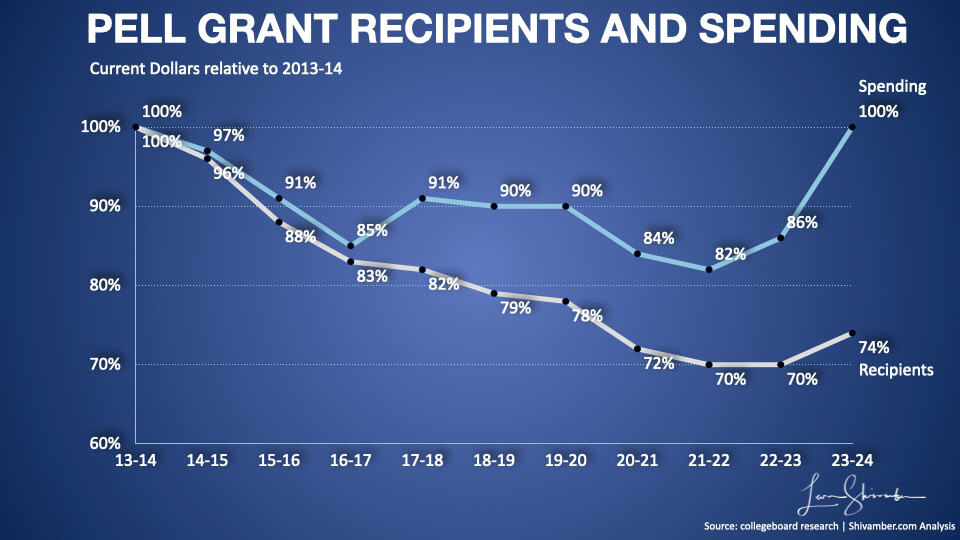
Every year, the federal government writes checks totaling over $31 billion to help low-income students attend college through the Federal Pell Grant program. (1)
That’s more money than the entire GDP of some small countries, flowing directly to 6.5 million students across nearly 6,000 colleges and universities nationwide.
To put in perspective the scale of that investment, it’s roughly half of the federal taxes collected from the bottom 50% of taxpayers (76 million taxpayers, $63B in federal taxes for the 2022 tax year). (2)
Yet for all its massive scale and noble intentions, a crucial question remains largely unexamined: Are we getting our money’s worth? (3)
Read on for an introduction to America’s most important Higher Education funding program.
“The Pell Grant is more than a financial aid program for college students in need. It is the right thing to do for America’s college students, and it is the right thing to do for America’s economy.”
Norm Coleman
The Scope and Scale of Pell Grants

To understand the significance of analyzing Pell Grant returns, as explored in the next chapter, it’s essential to grasp just how enormous and influential this program has become.
The Pell Grant is more than a government program. It’s the cornerstone of American higher education financing, serving as the primary federal tool for promoting college access among low-income families.
Since its creation in 1972, the program has assisted over 80 million students, including yours truly. It is fundamentally reshaping who gets to attend college in America.
Today, one in three undergraduate students receives a Pell Grant, with the average award of $4,819 helping to bridge the gap between what families can afford and what college actually costs.
The numbers tell a story of both success and challenge.
While the maximum grant has reached its highest nominal value at $7,395 for 2024-25, it covers a shrinking portion of college costs.
When Pell Grants were most generous in the mid-1970s, they covered three-quarters of the average cost of attending a four-year public university. Today, that same grant covers roughly one-third. (3)
Who Actually Gets Pell Grants?
The program demonstrates remarkable precision in targeting the nation’s most financially vulnerable students.

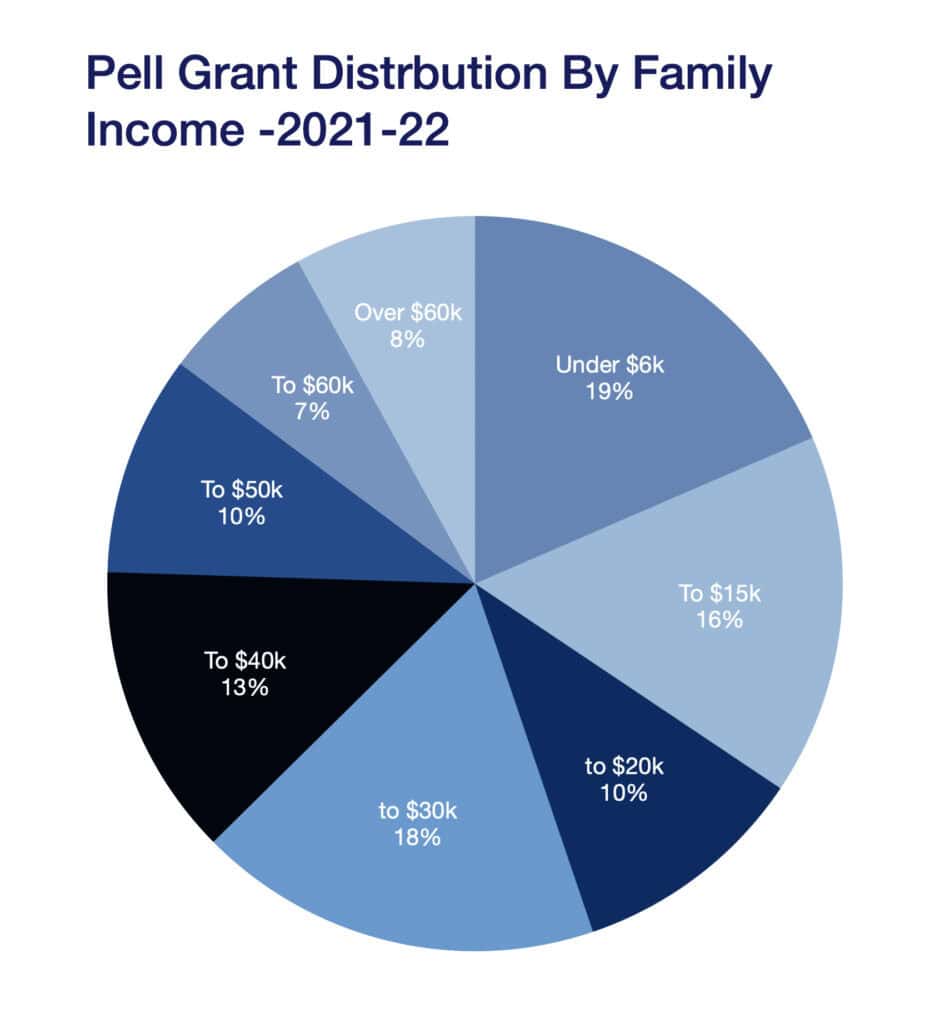
Sixty-one percent of recipients come from families earning less than $30,000 annually, with the single largest group having family incomes of $6,000 or less. (4)
Pell Grant Distrbution By Family Income -2021-22
Only 8% of recipients come from families earning over $60,000, underscoring the program’s effectiveness as an anti-poverty tool.(5)
Pell recipients also represent the face of American higher education’s diversity.
The program serves as a critical pathway for students of color, with nearly 60% of Black and 50% of Hispanic students receiving Pell Grants.
Additionally, 40% of student veterans and 50% of first-generation college students rely on this funding. (6)
The Great College Cost Mismatch
Here’s where the rubber meets the road, and why the institutional analysis becomes so crucial. While Pell Grants have remained relatively stagnant, college costs have exploded.
The average cost of college attendance now ranges from $20,570 for community college students to $62,990 for private four-year institutions**.(7)
This creates a fascinating—and troubling—dynamic.
A $7,395 Pell Grant might cover 36% of costs at a community college but only 12% at a private university. This means that where students choose to use their Pell Grant can dramatically affect their outcomes and the taxpayers’ return on investment.
The Hidden Complexity of “Success”
Most discussions about Pell Grants focus on access, including how many students receive them and whether the amounts are sufficient.
But this misses a more fundamental question: Does every dollar spent on Pell Grants generate equal value for students and society?
The reality is messily complicated.
Research consistently shows that Pell Grant recipients see 5-8% increases in earnings and that the federal government recoups the entire cost of grants within 10 years through increased tax revenues. (8)
But these are averages, and averages can hide enormous variation.
Consider this: A student using Pell Grants to complete a nursing degree at a state university might generate substantially different returns than someone pursuing the same degree at a for-profit institution, which costs twice as much. Similarly, a computer science major at a public university might create vastly different economic value than someone studying liberal arts at an expensive private college, even though both receive the same Pell Grant amount.
The Real-World Stakes
This isn’t just an academic exercise.
With Congress projecting a $2.7 billion Pell Grant shortfall by the end of 2025 and potential cuts of up to $1,685 per grant being proposed, understanding which investments work best becomes critical for preserving the program’s future. (9)
Recent policy changes have already begun reshaping the landscape.
New requirements mandate that students complete 30 credit hours annually (up from 24) to maintain full-time status, while eliminating eligibility for students enrolled less than half-time.
These changes could affect nearly half of current recipients, making it even more critical to ensure remaining funds generate maximum impact. (3)
Why Institution-Level Analysis Matters
This is precisely why examining returns on Pell Grant investments at specific institutions represents such an important shift in our thinking about financial aid effectiveness.
Rather than treating all colleges as equivalent, it acknowledges an uncomfortable truth: not all degrees are created equal, and not all institutions provide equivalent value for public investment.
The analysis reveals stark realities that challenge conventional wisdom.
Elite institutions with high-earning graduates might seem like smart investments, but their enormous costs mean Pell Grants cover only a tiny fraction of expenses.
Meanwhile, some less prestigious schools might generate superior returns by combining affordable education with strong employment outcomes.
The Path Forward
This granular analysis becomes essential as policymakers grapple with Pell Grant sustainability and effectiveness.
Rather than simply increasing grant amounts or expanding eligibility, we need to think more strategically about where those grants create the most value.
The program serves multiple goals: promoting access, supporting diversity, and driving economic mobility. However, with limited resources and growing pressure for accountability, understanding which institutions and programs deliver the best outcomes for students and taxpayers is essential.
The $31 billion annual investment in Pell Grants represents one of America’s most significant commitments to educational opportunity.
Whether that investment continues to grow and thrive may depend on our ability to ensure every dollar works as hard as possible for the students and communities it serves.
The following analysis examines return on investment across different types of institutions, revealing surprising insights about where Pell Grant dollars generate the most value for students and society.
Reference Sources
- Dortch, Cassandria. “Federal Pell Grant Program of the Higher Education Act: Primer.” Congress.Gov, 6 Nov. 2024, www.congress.gov/crs-product/R45418#:~:text=The%20federal%20Pell%20Grant%20program,do%20not%20repay%20Pell%20Grants. Accessed 25 Aug. 2025.
- York, Erica. “Summary of the Latest Federal Income Tax Data, 2025 Update.” Taxfoundation.Org, 18 Nov. 2024, taxfoundation.org/data/all/federal/latest-federal-income-tax-data-2025/. Accessed 25 Aug. 2025.
- “DOUBLE PELL.” Ncan.Org, www.ncan.org/page/pell. Accessed 25 Aug. 2025.
- Meyer, Katharine . “Pell Grant Cuts Threatens State College Access Goals.” Brookings.Edu, 5 Jun. 2025, www.brookings.edu/articles/pell-grant-cuts-threaten-state-college-access-goals/ Accessed 25 Aug. 2025.
- “National Student id Profile: Overview of 2024 Federal programs” NASFAA.org,
https://www.nasfaa.org/uploads/documents/2024_National_Profile.pdf Accessed 25 Aug. 2025. - “THE PELL GRANT: 50 YEARS OF OPPORTUNITIES.” Councilofpresidents.Org, councilofpresidents.org/2022/06/23/the-pell-grant-50-years-of-opportunities/. Accessed 25 Aug. 2025.
- Luthi, Ben, and Michelle Tipsword. “Average College Tuition for the 2024-2025 School Year.” Experian.Com, 8 Aug. 2025, www.experian.com/blogs/ask-experian/average-college-tuition/. Accessed 25 Aug. 2025.
- Denning, Jeffrey T., Benjamin M. Marx, and Lesley J. Turner. 2019. “ProPelled: The Effects of Grants on Graduation, Earnings, and Welfare.” American Economic Journal: Applied Economics 11 (3): 193–224.
- Schwartz, Natalie. “Pell Grant Program Projected to End Fiscal 2025 with $2.7B Deficit.” Highereddive.Com, 5 Feb. 2025, www.experian.com/blogs/ask-experian/average-college-tuition/. Accessed 25 Aug. 2025.