In 1982, Tom Peters and Robert Waterman published a book called In Search of Excellence. The two had met as consultants at McKinsey, and the book grew out of research they did inside the firm.[1] A few years later I joined McKinsey myself, and the book was still scripture.
It studied forty-three of what it called America’s best-run companies and distilled what they had in common into eight attributes. A bias for action. Staying close to the customer. The promise underneath was simple. Here is what excellence looks like. Copy it and prosper.
It became a runaway bestseller, some three million copies by the mid-1980s.[1] I remember the certainty of it. The authors were our own people, the companies were winners, and the patterns were right there on the page.
Some of those winners stumbled fast. Two years after the book came out, Business Week ran a headline asking “Who’s Excellent Now?”[2] That was embarrassing. The real test came later, and it was scored in money.
The unexcellent
A financial analyst named Michelle Clayman did what the book never did. She checked the other side.
First she built a basket of twenty-nine of the book’s excellent companies. Then she built a second basket of thirty-nine companies that scored worst on the very financial measures the book had used to crown its winners. She called them, wonderfully, the unexcellent.
She tracked both baskets for the five years after the book’s winners were chosen.
Both beat the stock market, so the excellent companies’ stocks didn’t collapse. But the excellent basket beat the S&P 500 by about one percent a year. The unexcellent basket beat it by more than twelve.[3]
Read that again. The companies picked for failing the excellence test beat the companies picked for passing it, and not by a little.
Years later Clayman ran the test again on a fresh window, and that time the strong performers came out ahead.[3] So the track record that crowned the winners was no reliable guide to where their stocks went next, in either direction. Her own lesson was that good companies “do not necessarily make good investments.”
The lesson I take from her work is to check the other side.
None of this makes the authors villains. They did what most of us do when we go looking for answers. They studied the winners. They found patterns that looked real. And they never asked the one question that would have tested the whole project.[4]
Do the failures share these patterns too?
What the winners can’t tell you
This might be the most human mistake in all of analysis. We look at winners. We find what they have in common. Then we decide those shared traits are what made them win.
The patterns may well be real. That’s what makes the mistake so hard to see. Say the excellent companies really were close to their customers. Now suppose the companies that went under were close to their customers too. Then closeness to customers doesn’t tell the winners from the losers. It’s something both do.
You can’t know that without looking at the failures. And the people selling the pattern rarely look, because failure doesn’t come looking for you. Success gives interviews, writes memoirs and fills the airport bookstore. Failure is quiet and a little embarrassed. It sits in the tables, and few people read that far.
The mistake has a name, survivorship bias, and it isn’t a new discovery. Statisticians have known about it since at least World War II, and good books cover the business version, among them The Halo Effect by the strategy professor Phil Rosenzweig.[4]
I wrote recently about the market version, predicting that the winning AI portfolios will get posted and the losing ones quietly deleted.[5] The lesson keeps getting forgotten because the mistake flatters us. Patterns are pleasant. Checking the failures is work.
So the defense has to be cheap, or nobody will use it. It’s one question, asked before any money moves.
Did anyone check the failures?
A pattern that shows up in winners and losers alike predicts nothing. A study that can’t answer the question hasn’t measured what it claims to measure. It’s a scrapbook of winners.
In an airport paperback, that mistake is survivable. It gets expensive when someone puts a price on the pattern. Clayman showed what a winners’ track record was worth to a stock buyer. Most families will meet a bigger version, priced in years as well as dollars.
Who’s missing from the photograph
Families hear this number again and again when colleges are sold. College graduates, it says, earn about $1.2 million more over a lifetime than people whose schooling stopped at high school. That’s Georgetown’s latest version.[6] The chart behind it climbs a neat ladder: more school, more pay. Few numbers have done more to sell the idea that college pays no matter what.
Now look at who’s in the photograph. The comparison has two columns. People who finished college. People whose schooling stopped at a high school diploma.
Picture a third student. She enrolled, borrowed, sat in class for two years, and left without a degree.
She isn’t in either column. She doesn’t belong in the first, because she has no degree. She doesn’t belong in the second, because her schooling didn’t stop at high school.
To be fair, the full tables do print her row, labeled some college, no degree, in Georgetown’s 2011 report and in the government’s.[7] But the gap everyone quotes runs from the bachelor’s row to the high school row, straight past the students in between.
She isn’t miscounted. She’s uncounted.
And she isn’t rare. At the median four-year college, roughly four in ten students who start haven’t finished there eight years later.[8] Some of them finished somewhere else. Many paid toward a degree that never arrived.
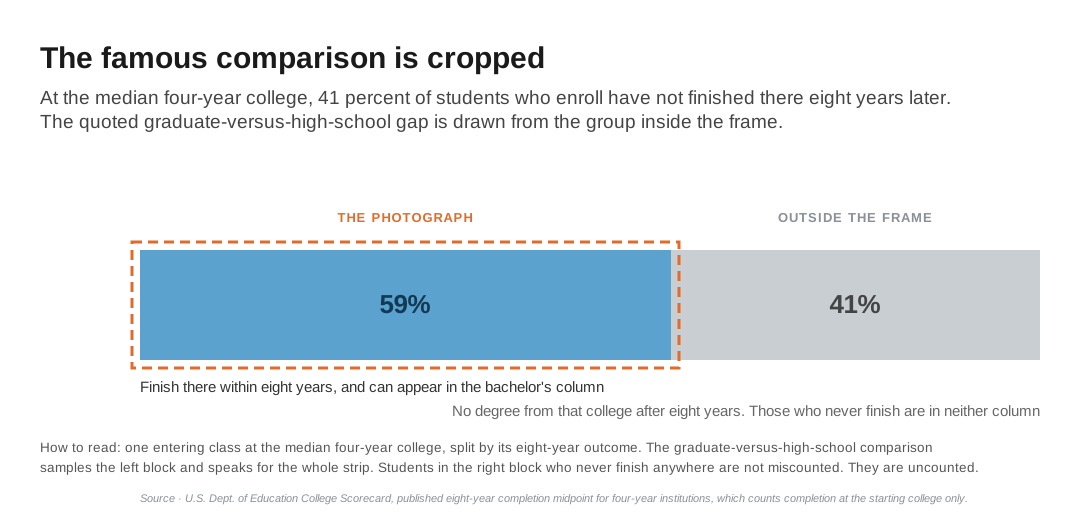
Let me be precise about who failed here, because it isn’t the students. They paid real money and gave real years, and then the accounting left them out. The failure in this story is a statistic that drops a big share of the people it describes and then speaks for all of them. The people it dropped are the missing evidence.
The famous number has other problems too. The $1.2 million is a gross sum. It subtracts nothing for the cost of college or for the years spent in class instead of at work. And it counts a dollar earned at sixty the same as a dollar in hand at eighteen. The ladder chart shows only full-time workers, sorted by how far they got in school. I audit all of that separately.[9]
This piece is about something simpler. Before anyone argues about the arithmetic, look at who was allowed into the sample. One of the most quoted statistics in higher education is built on the same winners-only method the excellence book used, at far higher stakes for each family.
Here’s why it matters to your family. You make the decision at enrollment, when finishing is a probability, not a fact. The $1.2 million is measured after graduation.
The famous number is built from the finishers. Your child hasn’t finished. Nobody has, on the day they enroll.
The statistic describes those who made it into the photograph. The decision belongs to everyone who walks in the door.
Count everyone who walks in the door
The corrected picture exists, and it’s arithmetic, not ideology. My model prices the decision when the family actually faces it, at enrollment. It uses each school’s own odds of finishing. It charges the student who leaves for the years she attended and the wages she gave up. And it credits her with the higher pay of workers who have some college but no degree.
Put her back in the sample and the verdict moves.
At sticker price, about 85 percent of four-year colleges leave the typical entering student worse off than going straight to work. Count only the graduates and that figure is 79 percent. At net prices after aid, about 65 percent still do, up from 57.[8]
Nothing about the colleges changed. Only who got counted.
I walk through the calculation in a companion piece, and my book We Need To Talk About Higher Education carries the full method.
You don’t need a model to use the question. A family can run it tonight. A school’s completion rate is public. Ask the school what happens to the students who start and don’t finish, and how many of them there are. A school that answers plainly is showing you the whole photograph. A school that keeps pointing at the alumni wall is showing you the survivors.
The question travels, too. Fund pitches built from a manager’s winning years. The habits of successful founders. The morning routines of billionaires. The colleges of Fortune 500 CEOs. Anything that sells you the shared patterns of survivors owes you the failures, and almost nothing that sells ever volunteers them.
The book on my shelf
I still own a copy of In Search of Excellence. It sits on the shelf as a reminder, not of two authors who got one wrong, but of how good the certainty felt at the time.
The authors were brilliant. The patterns looked real. The method was still broken, because of one question it never asked. That question costs nothing, and it could have cost the book its thesis.
So the next time someone shows you what the winners have in common, ask who’s missing from the picture.
Ask the failures. The survivors have already told you everything they know.
Reference Sources
- Peters, Thomas J., and Robert H. Waterman Jr. In Search of Excellence: Lessons from America’s Best-Run Companies. Harper & Row, 1982. Sixty-two companies screened to forty-three. Eight attributes. The screen, the attributes and the sales are summarized in David Collins’s 2024 paper on the book (open-access copy), cited in full in note 2. Collins records that the two authors “met while working for McKinsey and Co.” Robert Waterman’s page on Tom Peters’s website records that the two worked together at McKinsey & Company, on an internal project that produced the 7-S framework, a project that “in turn triggered the research that led to” the book, published in late 1982. Waterman adds that Peters had left McKinsey “partway through” the writing (tompeters.com, accessed October 26, 2026).
- “Who’s Excellent Now?” Business Week, November 5, 1984, pp. 46-54. Title and date as cited by David Collins, “Who’s Excellent Now? The Unspeakable Nature of Business Excellence,” Culture and Organization 30, no. 4 (2024): 425-441, https://doi.org/10.1080/14759551.2023.2290262. The article is in the Bloomberg Businessweek Magazine Archive, a library database from EBSCO.
- Clayman, Michelle. “In Search of Excellence: The Investor’s Viewpoint.” Financial Analysts Journal 43:3 (May-June 1987). Accessed July 30, 2026. Twenty-nine excellent versus thirty-nine “unexcellent” companies over the five years following selection: the excellent portfolio beat the S&P 500 by 1% per year, the unexcellent by over 12%. Clayman sorted both groups on the book’s financial yardsticks, not on its eight attributes, so the test speaks to the track record that crowned the winners, not to the habits. And “Excellence Revisited.” Financial Analysts Journal 50:3 (May-June 1994). Accessed July 30, 2026. The 1988-1992 re-run, in which the strong-fundamental companies came out ahead.
- Rosenzweig, Phil. “Misunderstanding the Nature of Company Performance: The Halo Effect and Other Business Delusions.” California Management Review 49:4 (Summer 2007). On Peters and Waterman’s method: a sample “made up entirely of outstanding companies,” chosen on their results. His book is The Halo Effect: . . . and the Eight Other Business Delusions That Deceive Managers. Free Press, 2007. Among statisticians, the survivor problem goes back at least to Abraham Wald’s memoranda for the Statistical Research Group at Columbia University during World War II, “A Method of Estimating Plane Vulnerability Based on Damage of Survivors,” reprinted by CNA in 1980.
- Shivamber, Leon. “Fooled by Fluency.” shivamber.com, August 2026. On survivorship in markets: “The winners will screenshot. The losers will quietly delete.”
- Carnevale, Anthony P., Stephen J. Rose, and Ban Cheah. Georgetown University Center on Education and the Workforce. “The College Payoff: Education, Occupations, Lifetime Earnings.” 2011. The source of the roughly one-million-dollar lifetime premium, in the full report. Georgetown’s 2021 update, “The College Payoff: More Education Doesn’t Always Mean More Earnings,” puts bachelor’s degree holders at a median of $2.8 million against $1.6 million for a high school diploma, a gap of about $1.2 million. The text and my audit in note 9 use that version.
- Bureau of Labor Statistics. “Education Pays.” Table 5.1, Unemployment Rates and Earnings by Educational Attainment, 2025. The ladder chart, including the some-college-no-degree row the quoted gap skips. Georgetown’s full report (note 6) prints the same row in its lifetime-earnings tables.
- Author’s model: completion-weighted return to the enrolling student. The four in ten comes from the College Scorecard’s eight-year completion rate, which counts only students who finish at the college where they started, so some of them may have finished somewhere else. The Scorecard prints that midpoint, 59 percent for four-year colleges, on each college’s page (example). Accessed September 26, 2026. The 85 and 65 percent figures cover the 1,656 four-year colleges that report an eight-year completion group, and they are the central case. The graduates-only figures in the text, 79 and 57 percent, are for the same 1,656 colleges. Across all 1,679 they are 79 and 58. Crediting all or none of the students the federal data cannot follow with a degree gives 79 to 89 percent at sticker price and 57 to 74 percent at net. The low end, 79 and 57, matches the graduates-only figures on the same colleges, because it assumes every student the federal data loses track of finished a degree somewhere. Full construction and figures in “Compared to What?” (collegeroi.org) and We Need To Talk About Higher Education.
- Shivamber, Leon. “Auditing the Numbers That Say College Pays.” collegeroi.org. The arithmetic audit of the famous numbers.