Here’s a quick quiz. Picture two California households. One is an average household in the poorest fifth, with about $14,000 a year in income. The other is an average household in the top 1 percent, with about $2 million in income. Which one pays a bigger share of its income in state and local taxes?
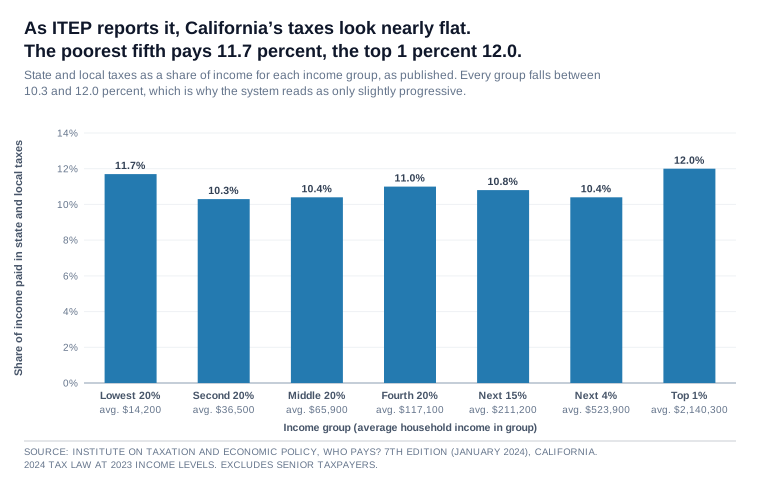
You’d probably guess the rich one, and by a lot. One study says it’s close to a tie. The poorest fifth pays about 11.7 percent of its income, and the top 1 percent pays about 12.0 percent. The study is the 2024 California report from the Institute on Taxation and Economic Policy, a widely cited source on who bears state and local taxes.[1]
It calls California’s system slightly progressive. A progressive tax takes a bigger share from people who earn more. Slightly progressive means the richest give up hardly more of their income than the poorest do.
That near-tie is part of the backdrop for California’s 2026 ballot measure, a one-time 5 percent tax on the state’s billionaires meant to raise tens of billions of dollars. If the poor already pay about the same share as the rich, taxing the top looks like the obvious fix.
The near-tie is real. But two things inside it do most of the work. One is a modeling choice about rent. The other is a sales tax that takes a much bigger bite out of a small income than a large one. Both weigh most at the bottom, against an income tax that weighs most at the top. Once you see them, the near-tie looks very different. I’ll take them one at a time, then look at what the flat chart can be used for, and at the bigger bill it leaves out.
This is not an argument about whether California should tax the rich more. It’s an argument for reading the number carefully before building policy on it.
The tax inside the rent check
ITEP reports the share of income each group pays in state and local taxes, and as Exhibit 1 shows, every group lands between about 10.3 percent (the second fifth) and 12.0 percent (the top 1 percent). That tight band is what makes the system look flat.
Now ask a different question. What do these households actually pay in cash, the taxes they hand over themselves? Sales tax at the register. Income tax taken out of a paycheck. The fee on a car. Those show up on a receipt or a pay stub.
A renter’s property tax doesn’t. Picture a family renting an apartment. They never get a property tax bill. Their landlord does. Economists assume the landlord passes part of that bill along in the rent, and that’s a fair assumption. So ITEP counts that part as a tax the family pays, even though no tax bill ever reaches them. It’s an estimate of who ends up carrying the cost, not money the family sends to the county.
That estimate sits inside a big part of the poor household’s number. ITEP puts it in one property line, along with the tax homeowners pay on their own houses, fees on cars and tax on business property. Of the poorest fifth’s 11.7 percent, about 5.4 comes from that line, close to half. For the top 1 percent, it’s only about 1.7.[1] For an average household in the poorest fifth, the property line comes to roughly $770 a year, about $64 a month.
That one line, much bigger at the bottom than at the top, is a big part of what flattens the picture.
Count only the checks people write
Take the property line out and the system looks more progressive than the headline suggests. Exhibit 2 does that with ITEP’s own numbers, and what’s left is a rough stand-in for the taxes people pay in cash. The poorest fifth pays roughly 6.3 percent of its income, mostly in sales tax. The top 1 percent pays roughly 10.3 percent, mostly in income tax.
That’s a gap of about four percentage points, or about four cents more on each dollar of income, where the headline shows almost none. In between, every group pays between about 7 and 8 percent, and then the share jumps at the top 1 percent.
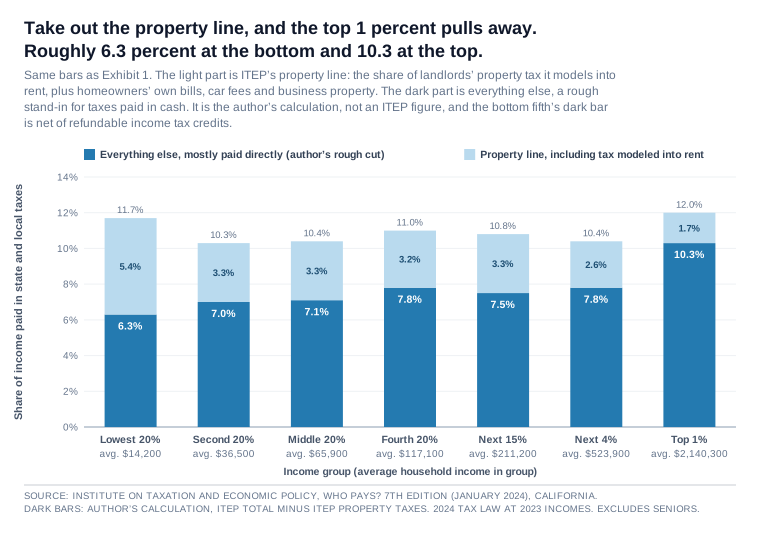
A word on how I got there. ITEP doesn’t report the rent part on its own. Its property line mixes rent with homeowners’ own property tax, car fees and business property, so I took the whole line out. That’s my own math on ITEP’s table, not a number ITEP publishes.
People can fairly argue about how much of a landlord’s property tax really shows up in the rent. ITEP’s estimate also likely runs high at the bottom, because it doesn’t appear to set aside some rent-capped housing the state exempts from property tax, as the fixes below explain.
The cut is rough in another way too, and this one could go either way. Taking out the whole property line also takes out real bills, like the tax homeowners pay on their own houses and the fees on their cars. Putting those back would raise the rate at the top, but it would raise the rate at the bottom too, and ITEP doesn’t say how much of the poorest fifth’s line is rent and how much is their own bills. What’s left also still holds some estimates, like the sales tax businesses pay on their supplies. So read four points as a rough size, not an exact one.
The basic point holds either way. Much of what the poorest renters are said to pay in tax may reach them through the rent, and they never see it as a tax bill. Most of what the top 1 percent pays, they pay directly, in cash they can see.
Dollars tell a different story. Using ITEP’s average incomes, a household in the poorest fifth pays on the order of $1,700 a year in state and local taxes. A household in the top 1 percent pays something closer to a quarter of a million dollars. That’s well over a hundred times as much. Nearly all of that difference comes from the gap in income, but it’s the part a chart of percentages doesn’t show.
By ITEP’s own figures, the top fifth of earners already carries the large majority of the state’s personal income tax.[1]
ITEP’s choice is reasonable economics. Its picture shows who it thinks ends up carrying the cost. The cash view shows who writes the check. Both are useful, and they point to different fixes.
Two taxes pull down, one pulls up
Rent isn’t the only thing flattening the total. The sales tax does it too, and most of it isn’t hidden. The poor pay it in cash, at the register. ITEP breaks the total into three big pieces, and as Exhibit 3 shows, they pull in opposite directions.
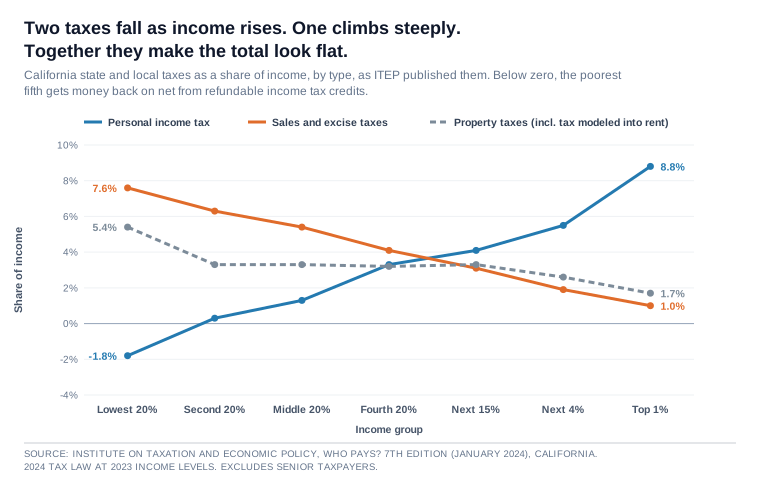
California’s income tax is steeply progressive. The poorest fifth gets money back on net, about 1.8 percent of its income, through refundable credits like the Earned Income Tax Credit. The top 1 percent pays about 8.8 percent.[1] In dollars, that’s about $256 back for an average household in the poorest fifth and about $188,000 paid by an average household in the top 1 percent. Measured either way, the income tax rises steeply with income.
Sales and excise taxes run the other way, from 7.6 percent of income at the bottom to 1.0 percent at the top 1 percent. That isn’t because rich Californians pay a lower rate at the register. The rate doesn’t change with income. The difference is that sales tax only reaches the money people spend, and the rich spend a much smaller share of their income and save more of it. A poor family can rarely save at all, so far more of its income passes through the register.[1] Property taxes, including the rent estimate, fall too, from 5.4 to 1.7, for a similar reason: housing takes a bigger share of a small income than a large one.
Put one steeply progressive tax next to two that fall as income rises, and the total comes out nearly flat.
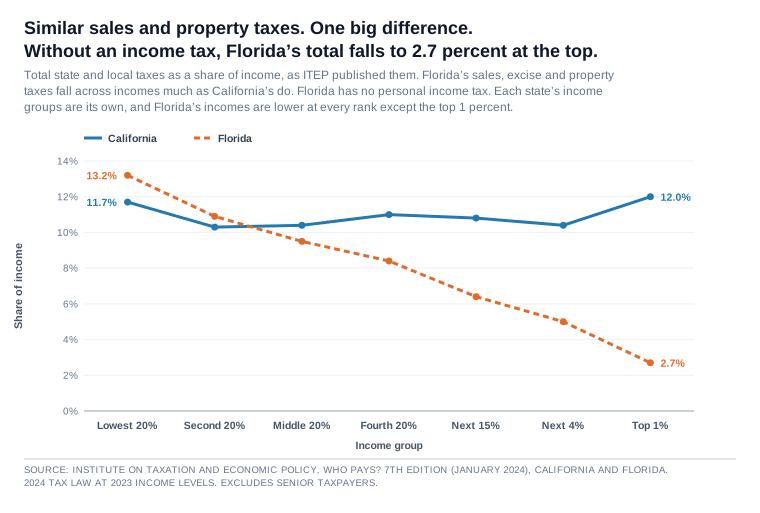
Florida shows how much work California’s income tax is doing, as Exhibit 4 shows. Florida’s sales and property taxes fall across incomes much as California’s do. But Florida has no personal income tax, so its total falls from 13.2 percent at the bottom to 2.7 percent at the top 1 percent, and ITEP ranks it the most regressive system in the country, meaning poor and middle-income families pay a larger share of their income than the rich do.[1]
Take away California’s income tax and its rates would look a lot like Florida’s. Keep it, and California’s top 1 percent pays about 12.0 percent, against 2.7 percent in Florida. For a high earner weighing a move, a gap that size is hard to ignore.
ITEP’s breakdown by tax type also points to a lever, the sales tax. Take sales and excise taxes out of ITEP’s totals and the rates run from about 4 percent at the bottom to 11 percent at the top 1 percent, and the bottom figure still includes the rent estimate.
Much of the flat total, then, comes from how California taxes spending, not from a light tax at the top. With every tax counted, the top 1 percent’s rate, 12.0 percent, is still the highest of any group, though only just above the 11.7 percent for the poorest fifth. For the poorest fifth, sales and excise taxes are also the biggest tax bill, 7.6 percent of income against 5.4 for the whole property line, and most of it is paid at the register.
The sales tax is a choice the state makes, and lawmakers can change it far faster than they can bring down rents. A credit that gave the poorest fifth back its sales and excise taxes would cost a small share of what those taxes raise. By my math on ITEP’s table, the poorest fifth pays a little over 5 percent of the sales and excise taxes ITEP counts. Its sales and excise payments come to less than 2 percent of all the state and local taxes ITEP counts. Cutting sales and excise taxes for everyone would be a different matter. They bring in more than a quarter of California’s state and local tax revenue.
So the flat total has two sources, and both weigh most at the bottom. The trouble starts when the flat-looking chart becomes the evidence for a policy.
Where the chart meets policy
If a tax system looks nearly flat, raising taxes on the very top looks like the obvious fix. California’s Proposition 40, the 2026 Billionaire Tax Act, would charge residents worth more than a billion dollars a one-time tax of 5 percent, which they could spread over five years at extra cost. The state’s Legislative Analyst says it would apply to a few hundred billionaires and raise tens of billions of dollars, with 90 percent going to health care services.[2]
Supporters pitch it as a one-time answer to federal cuts to health care. It’s tied to where people lived on January 1, 2026, a date before the vote. Opponents say that makes it unconstitutionally retroactive, meaning it reaches back to a time before the law passed. Supporters answer that many taxes take effect at the start of the year they pass. That point will likely be fought out in court rather than settled.[3]
Whether wealth taxes bring in more money than they lose is a real, open question. One of the most watched tests is Norway, though Norway’s tax comes every year and California’s would come once.
In 2022 Norway raised its wealth tax on the largest fortunes from 0.85 to 1.1 percent, along with higher taxes on dividends and capital gains. In 2025 that top rate started at about 20.7 million kroner.[4]
After the increase, more of the rich started leaving. The Norwegian think tank Civita counted 261 residents with more than 10 million kroner in assets leaving in 2022 and 254 in 2023, more than twice the pace before the increase.[5] By 2024 some 300 multimillionaires and billionaires had moved to Switzerland alone.[4] One of them was Kjell Inge Røkke, described as Norway’s largest taxpayer, whose wealth-tax bill ran about 175 million kroner in a single year.[6]
Here’s the part that cuts both ways. Norway’s wealth-tax receipts actually went up, from about 27 billion kroner in 2022 to an estimated 34 billion in 2025. On that line of the budget, the tax worked.[4]
But critics say the people who leave take their future investment with them, and that the tax risks hollowing out Norway’s base of entrepreneurs, as Reuters summed up their case. A Princeton researcher, Christine Blandhol, estimates the changes could lower Norway’s long-run output by about 1.3 percent, with about 40 percent of the people leaving being business owners. These are disputed projections, not settled results.[5]
Even California’s governor, Gavin Newsom, has called the proposal “really damaging,” and TIME reported that a handful of billionaires, among them Larry Page and Peter Thiel, had started moving assets or opening offices elsewhere before the residency cutoff.[7] Some have left outright. A Hoover Institution study counts six billionaires who publicly left California between the measure’s filing and the January 1 cutoff, taking about $536 billion, nearly 30 percent of the state’s billionaire wealth, out of the tax base. Its authors estimate that more may have left without announcing it.[8]
So a wealth tax can bring in more on its own line while shrinking the income taxes the people who leave used to pay. For California, the Legislative Analyst expects tens of billions of dollars spread over several years, and likely an ongoing loss of hundreds of millions of dollars or more a year in income tax.[2] How that nets out is exactly the question the flat chart skips.
Grant, for argument’s sake, that the flat total is the right measure and that the system needs fixing. A one-time tax on a few hundred billionaires doesn’t touch what makes it flat. The chart measures the taxes people pay every year as a share of income. Once the payments end, sales and excise taxes still take 7.6 percent of the poorest fifth’s income, the rent estimate is still there, and the bottom of the chart looks the way it does today.
Five years from now, the same chart could make the same case.
And if the real problem is a gap between what the state collects and what it spends, even money paid over five years doesn’t explain how the gap stays closed after that, or what keeps spending in line once the money arrives. In my view, taxpayers have watched budgets grow to fit new money before, and they’re right to ask.
The bigger bill is the rent
None of this explains why so many families at the bottom struggle in the first place, and that’s where the flat chart pulls attention away. The property tax the chart assigns to poor renters arrives through their rent, and the rent itself is the bigger problem. A Niskanen Center study by Zachary Parolin finds that California’s high housing costs are the main reason the state has the highest poverty rate in the country, in a state with well-documented trouble building enough housing.[9] In my view, the zoning and land-use rules that slow the building of apartments near jobs do more to set rents than the property tax does.
That points to fixes the wealth-tax debate mostly leaves out. The first is a property-tax circuit breaker, a credit that gives back some property tax when it takes too big a bite of a household’s income, and most states that offer one extend it to at least some renters. California doesn’t offer one to low-income households under 65, and it would directly ease the part of the property tax that reaches renters through rent.[1]
The second is sales tax relief: the credit above, which gives the poorest fifth back what it pays at the register, or trimming the tax on everyday necessities beyond the groceries California already exempts. Other states already offer such credits. Maine, for one, offers a refundable sales tax credit.[1] By the math above, a credit like that would cost a small share of what those taxes raise, and I think it’s a fix higher earners could readily back, because it answers the charge that the system is regressive at its source.
The third is property tax relief on low-income rental housing. California already exempts such housing, in whole or in part, when a qualifying organization owns it, caps its rents and rents it to lower-income households.[10]
Widening the exemption to other owners who agree to the same rent limits is one option. Whether it would lower rents is less clear, but it should make that housing more attractive to build and own.
The exemption also matters for the poorest fifth’s property line. ITEP starts from each renter’s reported rent, turns it into an expected property tax using typical tax rates and assigns half of that to the tenant.[1] Nothing in its method description adjusts for exempt units, so it appears to count a tax even on units that pay little or none. Those units go to lower-income households, and the state’s income limits for them start around $52,600 for one person,[10] well above the poorest fifth’s ceiling of $25,200.[1] So some of the poorest fifth’s property line is likely overstated, by an amount the report doesn’t let us measure.
The fourth is easing zoning near transit so more housing gets built, and the research the Niskanen study draws on finds that more housing lowers rents.[9] The fifth, I think, is loosening occupational licensing, which would open more paths to start a business and earn more.
A careful reader doesn’t have to take a side to see the point. Take the income tax first, the one big tax California builds on income. It is steeply progressive, from money back at the bottom to 8.8 percent of income at the top 1 percent.
The two other big pieces run the other way. A sales tax the poor pay at the register and a reasonable, if imperfect, estimate of the tax inside rent weigh most at the bottom, and laid over the income tax, they make the total look flat. Counted roughly in cash, the system is already more progressive than the headline. Below the top, it stays between about 6 and 8 percent, and then it jumps at the top 1 percent.
Policy built on the flat total risks chasing taxpayers who can pack up and move, while leaving alone the housing and wage problems that actually trap people at the bottom.
The useful debate is bigger than how much more to collect from the top. It includes which taxes on the poor to cut first, what kind of tax system keeps high earners and their income in the state, and which housing and licensing changes would let people at the bottom earn more rather than merely pay less.
Reference Sources
- Institute on Taxation and Economic Policy. “Who Pays? California.” ITEP, 7th ed., 2024. Accessed September 29, 2026. Full report: “Who Pays? A Distributional Analysis of the Tax Systems in All 50 States.” ITEP, 7th ed., January 2024. The published effective rates (bottom 20 percent 11.7 percent, top 1 percent 12.0 percent) and the property-tax component by income group (about 5.4 points for the bottom quintile, 1.7 for the top 1 percent). ITEP’s figures exclude senior taxpayers. The cash-versus-imputed decomposition in this essay is the author’s own calculation from ITEP’s published figures, not a number ITEP reports. Exhibit 2’s dark bars are each group’s ITEP total minus its property line. The roughly $770 a year is the bottom fifth’s property line (5.4 percent) times its average income of $14,200. Florida’s figures, ITEP’s ranking of Florida as the most regressive system, and the point that sales tax reaches only spent income are from the full report. With sales and excise taxes taken out, ITEP’s totals run from 4.1 percent to 11.0 percent. The poorest fifth’s share of sales and excise taxes (about 5.5 percent) is the author’s calculation from ITEP’s group rates, average incomes and group sizes. Those payments equal about 1.6 percent of all state and local taxes ITEP counts. ITEP’s group figures count only taxes paid by non-senior residents, while Appendix C counts all revenue. The $256 and $188,000 are the personal income tax rates (-1.8 and 8.8 percent) times average incomes of $14,200 and $2,140,300. Maine’s refundable sales tax credit is from the full report. ITEP’s method for renters (reported rent, typical price-to-rent ratios and rental tax rates, half assigned to tenants) is from the full report’s methodology appendix. Sales and excise taxes are 28.5 percent of California’s state and local tax revenue (ITEP Appendix C, calendar year 2023). The top fifth’s share of personal income tax, about 83 percent among the non-elderly households ITEP counts, is the author’s calculation from ITEP’s group shares, average incomes and rates.
- California Legislative Analyst’s Office. “New Tax on the Wealth of Billionaires (Ballot Initiative 2025-024).” Legislative Analyst’s Office, December 11, 2025. Accessed September 29, 2026. The initiative’s scope (a few hundred billionaires), the January 1, 2026 residency date, the five-year payment option at extra cost, the share for health care, the tens-of-billions revenue estimate, and the likely ongoing loss of income-tax revenue.
- Galle, Brian, David Gamage, and Darien Shanske. “California’s Prop 40: Responses to Common Objections.” ITEP (guest blog), September 28, 2026. Accessed September 29, 2026. The measure’s number, its defenders’ case that it answers federal cuts to health care, and the retroactivity objection with their reply.
- “How Norway’s Wealth Tax Drove Out the Rich Without Breaking the Bank.” The Local Norway (AFP), 23 Oct. 2025. Accessed September 29, 2026. Norway’s wealth-tax increase from 0.85 to 1.1 percent and the 20.7-million-kroner threshold for the top rate in 2025, the figure of about 300 multimillionaires and billionaires moving to Switzerland by 2024, Civita economist Mathilde Fasting’s warning that people who move out stop investing in Norway, and the rise in wealth-tax receipts from 27 to about 34 billion kroner.
- Canepa, Francesco, and Terje Solsvik. “Analysis — Norway’s Lesson for Europe on Wealth Taxes: Let Some Millionaires Go.” Reuters, 24 Nov. 2025 (syndicated via Investing.com). Accessed September 29, 2026. The Civita figures of 261 residents (assets above 10 million kroner) leaving in 2022 and 254 in 2023, “more than double” the prior pace, critics’ warning that the tax risks hollowing out Norway’s entrepreneurial base, and Princeton researcher Christine Blandhol’s estimate that the latest tax changes will cut Norway’s long-run output by about 1.3 percent.
- “Politicians Criticize Tycoon’s Move to Switzerland.” News in English Norway, 12 Sept. 2022. Accessed September 29, 2026. Kjell Inge Røkke’s move to Switzerland and his wealth-tax bill of about 175 million kroner in a single year, which a Norwegian newspaper said made him the country’s biggest taxpayer.
- Greene, Connor. “What to Know About California’s Proposed ‘Billionaire Tax.'” TIME, 13 Jan. 2026. Accessed September 29, 2026. Governor Newsom calling the proposal “really damaging,” and billionaires including Larry Page and Peter Thiel moving assets or opening offices elsewhere before the residency cut-off.
- Hoover Institution. “California’s Proposed Billionaire Tax Will Cost the State an Estimated $25 Billion, Hoover Study Finds.” Hoover Institution (press release), March 5, 2026. Accessed October 21, 2026. The six billionaires who publicly left California between the initiative’s filing and the January 1, 2026 residency date, the $536 billion, nearly 30 percent of aggregate billionaire wealth, removed from the tax base, and the authors’ estimate that many more may have left without a public announcement. This essay does not use the study’s revenue estimates.
- Parolin, Zachary. “Housing Policy and Poverty: The Case of California.” Niskanen Center, July 8, 2025. Accessed September 29, 2026. California’s high housing costs as the main reason the state has the highest poverty rate in the country, and added housing supply as an anti-poverty tool.
- California State Board of Equalization. “2026-27 Income Levels for the Welfare Exemption.” Letter to County Assessors No. 2025/034, September 29, 2025. Accessed October 22, 2026. The welfare exemption for rental housing owned by a qualifying organization and occupied by lower-income households, with rents held to the limits in Health and Safety Code section 50053 or the financing terms (Revenue and Taxation Code section 214(f) and (g)). The $52,600 is the lowest one-person income limit across counties in the letter’s Attachment A, for fiscal year 2026-27.