The return on investment of a college degree depends on the costs of getting the degree and the earnings you will generate as a result of that investment.
It’s important to note that this calculation is not an exact science. We are required to make educated assumptions about the future.
Any model will have flaws. Despite those shortcomings, we can develop models illustrating the differences between choices in varying circumstances.
These models can help us understand the key variables at work and how they influence the final result positively or negatively.
Furthermore, decision-makers can begin to understand the likelihood of their particular choice or scenario delivering a good return on their investment.
We developed a comprehensive model precisely because the existing discourse on this matter was oversimplified, leading to misguided assertions.
This model presents a significant step towards a more nuanced understanding of the return on investment of a college degree. We expect it to empower decision-makers with a deeper insight into the financial implications of their choices.
When we understand the implications of a decision, we can make better college decisions.
“The only relevant test of the validity of a hypothesis is comparison of prediction with experience.”
Milton Friedman
Our Model Design Philosophy
A college investment is a pivotal decision. It will create enormous opportunities for some and can be a bad idea for others.
Understanding all the critical variables and how they affect those results is fundamental to making a good investment.
Here, we will define a college investment decision as a bundle of choices that collectively impact a lifetime of earnings. These include:
- The chosen field of study
- The college choice
- How much the student pays, which in turn is affected by:
- The total cost per year of the school
- Grants and scholarship reductions are affected by family financials and student academic performance
- How long does it take for the student to graduate
- Whether the student works and how much the student earns while attending college
If it’s a good investment, it should set the graduate on a lifetime earnings path that is, on average, better than the alternative (graduating high school and going to work). Therefore, the high school graduate’s earnings are an essential benchmark for the college investment.
We recognize that an actual lifetime of earnings also heavily depends on the economy, the performance of the chosen employer, the performance of the employee, and personal situations (such as leaving the workforce to care for a family member).
We also understand that early on, the college decision is important. The further one goes from graduation, the more critical the latter factors.
Thus, our synthetic model of a lifetime of earnings best reflects the impact of college by favoring the near-term impact. We take the lifetime of earnings, but we discount the later periods more heavily. Thus, they have a negligible effect on the results.
Our model projects the costs and earnings of high school and college graduates. We adjust for taxes and then use the discount cash flow method to calculate the net present value (NPV). The NPV tells you how much it’s all worth when the decision is made (today).
You can perform a benchmark comparison of the median high school and college graduates and specific scenarios for a particular student.
We hope decision-makers will use our model or similarly comprehensive evaluations to understand their choices.
To utilize our model effectively, you must grasp its inner workings, the data it relies on, and the assumptions that shape its results. Your active understanding of these elements will empower you to make informed decisions.
We actively encourage and value your recommendations to enhance our methodology. Your insights, integral to the improvement process, can help us further refine our model, making it more comprehensive and beneficial for all.
This article thoroughly discusses our sources, including reputable government databases, our assumptions, and the reasoning behind them.
We also conducted rigorous validation tests to ensure the accuracy and reliability of the data used in our model, instilling confidence in its results.
The three main categories of data and assumptions are the costs associated with going to college, the earnings likely to be generated by skipping or going to college, and other general assumptions, such as the discount rate.
Cost Assumptions
Our model uses various cost assumptions and adjusts them based on general college cost inflation rates to calculate the total spent throughout college.
Out-of-pocket costs to attend college
Our model requires prospective college students to identify the out-of-pocket costs of attending their chosen college.
We like to use scenarios around their estimate, so we suggest they also provide their school’s total and median costs. We provide additional analysis of what it would be worth to attend that college if the student did not have to pay fees (a zero-cost scenario).
You will find much of the data you need on the College Scorecard website, developed by the U.S. Department of Education. However, you will need to know where and what to look for.
Go to the College Scorecard website. (1)
Search for any college and click on the detail page. There, you should find the average annual costs and the midpoint of four-year schools. You can also find links to the school cost calculator if they have one.
You will have to start with the school’s estimate of total costs. These include tuition, fees, and other living expenses. Use the appropriate costs for out-of-state versus in-state, depending on your situation. From that number, you will deduct any expected scholarships or grants you will receive.
Do not factor in loans. They do not reduce your out-of-pocket cost. Loans only change when you pay those costs.
Fortunately, the College Scorecard site also provides more data you can download. (2)
Included in the data are the estimated total costs
We have downloaded and added excerpts of this data for our users with our models.
The additional data is in a sheet labeled Raw CS Data May 24. Column I shows the average net price, and Column J shows the average total price.
Caveats – Out-of-pocket costs to attend college
The college scorecard understates costs.
If a college has a reasonable cost calculator, we suggest you start there.
How much you pay will largely depend on your chosen school. It is also affected by whether you will live at home or away, are paying in-state or out-of-state costs, and the grants or scholarships you receive. The latter will be affected by your financial situation and academic strength.
Financially constrained and excellent students will get more significant relief against the economic costs.
Cost Increases
We assume an annual increase in your starting costs for years two through four of college.
When we built our first model in 2012, we calculated the annual cost increase at 5.6%. We used the following data sources: 1987-88 and after: data from Annual Survey of Colleges, the College Board, weighted by full-time undergraduate enrollment(3); 1986-87 and prior: data from Integrated Postsecondary Education Data System (IPEDS), U.S. Department of Education, National Center for Education Statistics, weighted by full-time equivalent enrollment.
I’ve attached an image below showing updated cost increases. Between 2002 and 2012, tuition, fees, and housing costs increased annually by 4.8% for private and 6.6% for public schools.
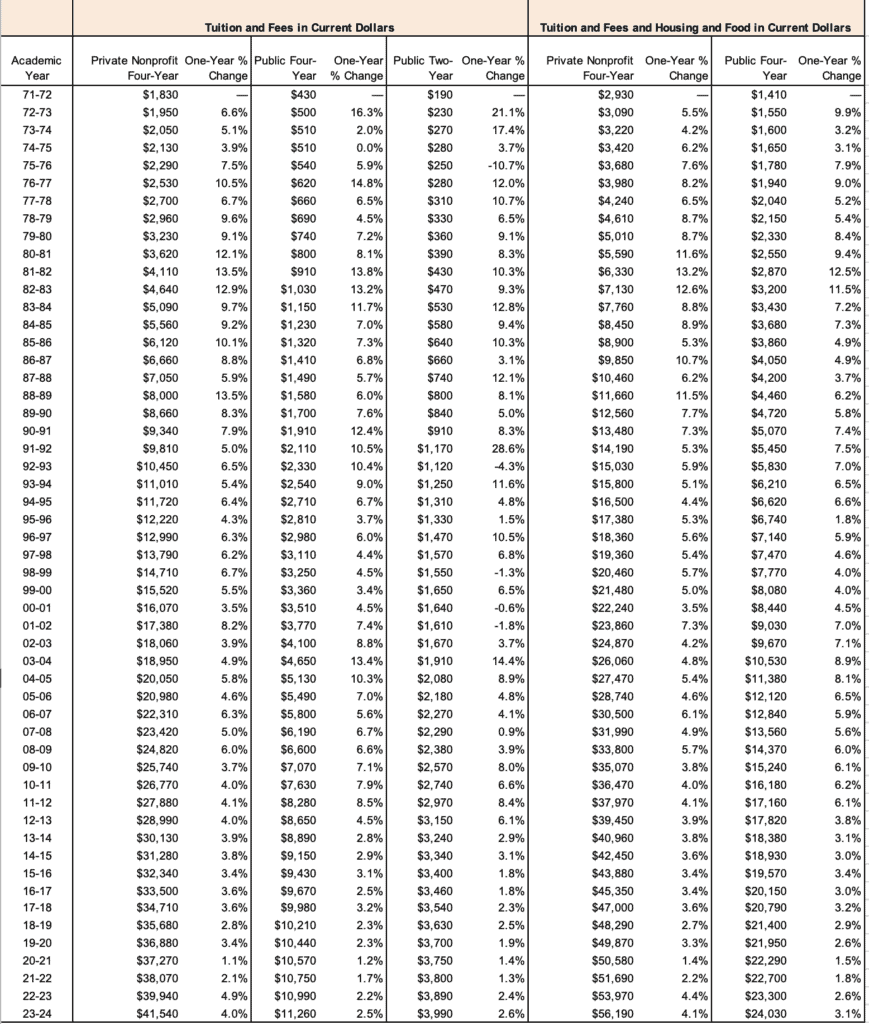
The most recent cost increases are 3.2% and 2.7%, respectively, or approximately 3% overall.
However, recent inflation rates suggest the slower rates may be behind us.
Cost Increases – Caveats
We use 5.6% to allow comparability with our 2012 model. Because our model uses a discount rate for NPV of 7.8%, this reduces the impact of our choice of growth rate.
We leave it to you to decide whether to assume a 5.6% annual increase or your custom rate of cost inflation. Unless you make dramatic assumptions, we do not expect this choice to impact the conclusions significantly.
Our model assumes four years to graduation, even though only 49% of students do so. (4)
This assumption favors college attendance as it generally understates the total cost of attending college. The longer one takes to graduate, the larger the accumulated costs one will experience.
Earnings Assumptions
Our model uses starting salaries and adjusts them based on general salary inflation rates to calculate a lifetime of earnings. We do so for the median high school graduate, the median college graduate, and the median graduate in your chosen college (in your field of study, if applicable), and we allow you to create a custom version based on your self-assessment.
High School Graduate Earnings
Let’s start with the median high school graduate. We chose the U.S. Census Bureau and U.S. Bureau of Labor Statistics, Current Population Survey, March Supplement (IPUMS) of 22 to 27-year-olds. It’s the closest we can find to a reliable starting salary source for high school graduates. (5)
The other sources are 25 to 34-year-olds or medians for 25-year-olds and older. These age groupings are much further away from high school graduation and subject to other variability, so we do not suggest using them. We prefer using the solid salary estimate, but closest to high school graduation.
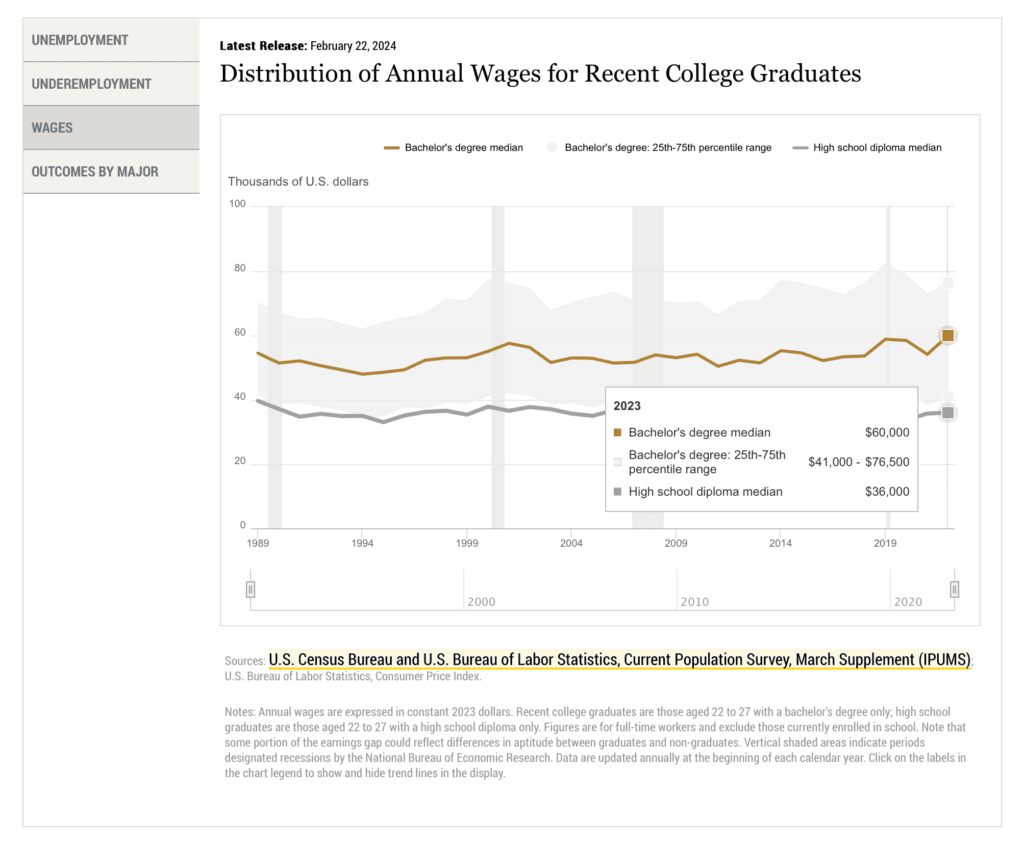
Of course, since these numbers are 4 to 5 years after graduation, we have to adjust them back to our estimated starting salaries when the high school graduate is 18.
Our recent model tells us that the median salary for high school graduates aged 22 to 27 is $36,000 (see chart above, IPUMS data).
For simplicity, we assume the median age is 24.5 and discount the salary by 6.5 years to get to the median starting salary of a typical 18-year-old high school graduate. We will explain the discount/inflation rate of earnings below.
Median College Graduate Earnings
We rely on the U.S. Department of Education data for all our college salary information. (1)
Using Harvard University as an example (see image below), we can find that the median earnings at Harvard are $95,114, and the midpoint for four-year schools is $50,806.
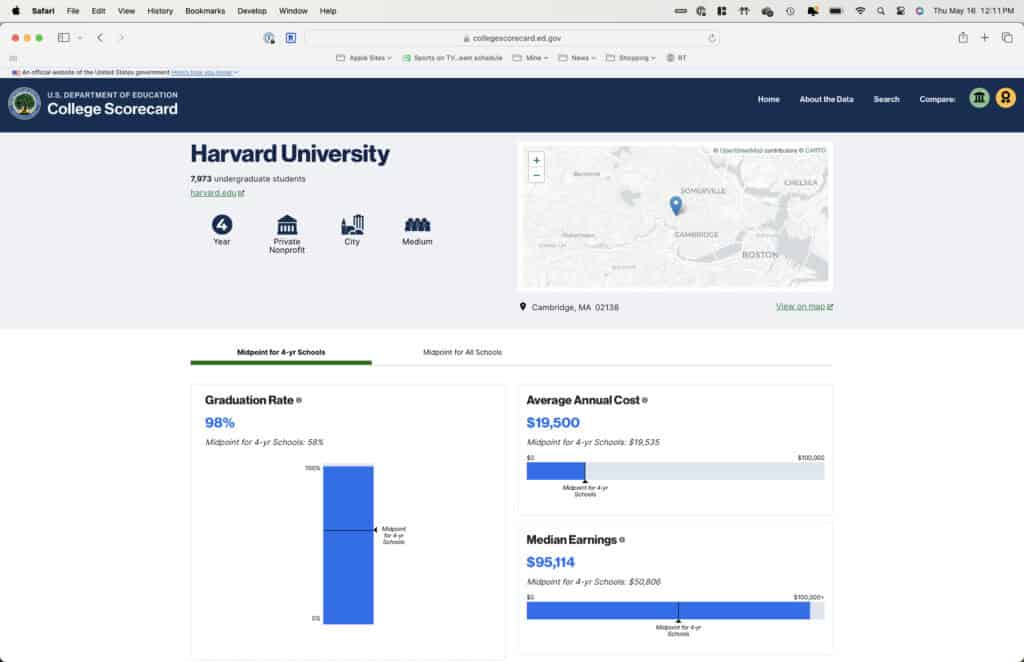
The data is MD_EARN_WNE_P10, which stands for “the median annual earnings of individuals that received federal student aid and began college at this institution 10 years ago, regardless of their completion status.”
When you look at the field of study data on the same website, you can find the median salary of specific fields of study by college. For example, the median is $256,539 in Computer Science at Harvard. The data is EARN_MDN_4YR, or “the median annual earnings of students four years after graduation. Only data from students who received federal financial aid are included in the calculation.“
You will notice that the government likes to present data well after college graduation. In the first case, ten years after enrollment; in the second, eight years (assuming a standard four-year time to graduation).
If you download the data from the website for field of study data online, you will find that they also capture:
- Median earnings of students working and not enrolled six years after entry – MD_EARN_WNE_P6
- Also, the above for 8 and 9 years – MD_EARN_WNE_P8, MD_EARN_WNE_P9
- Median earnings of graduates working and not enrolled one year after completing the highest credential for the field of study – EARN_MDN_HI_1YR
- Above for two years after completing – EARN_MDN_HI_2YR
In every case, it would be helpful to get the data closest to the graduation or enrollment data and build from there, but the government has made it more difficult to find.
For every choice above, we have to discount to the appropriate starting point in our model after graduation.
For example, when we use the ten-year-after-enrollment salaries, we must go backward to compute the likely salary when the individual graduated four years after college.
We have to assume a growth rate for salaries to discount salaries backward.
Salary Inflation or Growth Rates
We provide the opportunity to use separate rates for high school and college graduates. However, our analysis shows negligible differences over long periods.
When we first did this analysis in 2012, we explored salary changes historically and settled on a 2% rate for high school and college graduates.
A recent research paper, Deming 2023, based on a different timeframe, finds “Among respondents with ten or more years of work experience, real wages grow by an average of 0.9, 1.5, and 1.8 percent per year for workers with a high school degree, some college, and a bachelor’s degree or more, respectively.” Using the 1.8% (although it includes more than bachelors), and the 0.9% for HS grads provides NPVs of $367k for median college versus $403K for High School. This result shows a negligible difference between our standard 2% rate for both.
It should be noted that many researchers use a Zero growth rate for both. That is, they do not assume any growth over the lifetime.
We don’t find a compelling case for changing the base model assumptions for most cases, unless you have some data that show faster acceleration in the near term for your given field of study, or you have some reason to believe these will diverge significantly in the future.
Earnings Caveats
The college scorecard data inflates our starting salary assumptions for college graduates.
In our model, we assume a standard four-year time to graduation. Using the salary data for ten years after enrollment, we would look at the salaries for someone who has been in their career for six years. One or more job promotions have probably occurred, resulting in a higher salary growth rate than standard.
We also realize that our model does not vary the growth rate over time. We are trying to isolate effects that can be genuinely related to the college degree. In our experience, significant positive divergences in salaries occur from a good economy, a successful company, or individual job performance. The further one progresses in a career, the less influential the college degree.
Finally, the median earnings data only represent students who received federal aid, which may introduce some bias. However, a cursory comparison to other websites measuring the median starting salary for alumni at various colleges provided lower estimates. This comparison means our median salaries are typically higher than the overall median and favor the college graduate.
Other Assumptions
We use the standard federal interest rate brackets and assume a single taxpayer.
We do not adjust for state taxes, so the results of the higher-earning choices are overstated. If you live in a high-tax state, keep that in mind. You can certainly tweak the model to include higher taxes, state-level impact on earnings, etc., and see the effect on your choice.
Time to graduate
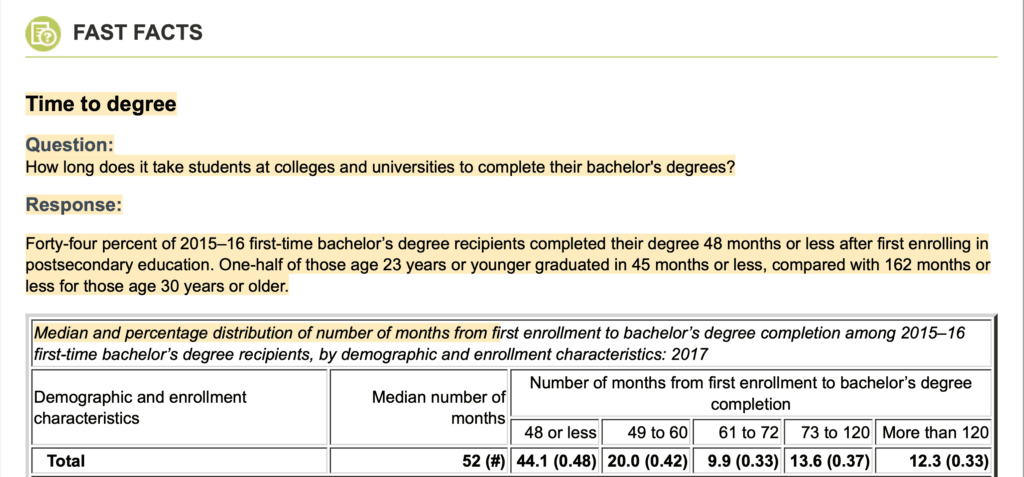
The National Center for Education Statistics found that only 44% of students who started a bachelor’s degree in 2015-16 completed it within 48 months (4 years). The median time to completion was 52 months.
For our model, we assumed a favorable 4-year time to graduation. Remember that the returns will be lower when it takes longer to graduate than the base model presented. This assumption favors college graduates.
The discount rate
Every investment model uses an Interest rate for the Discount Cash Flow Analysis. We do, too.
The appropriate discount rate reflects the risk of the investment, the time horizon, the cost of capital of the individual investor, what someone could be earning otherwise on their investments, inflation, and other factors.
The consensus for evaluating risky investments of forty years or more duration is to use a discounting range of 12% to 20%.
Here is the Federal Reserve when they did a similar analysis in 2014: “Because the costs of college are paid today but the benefits accrue over many future years when a dollar earned will be worth less, we discount future earnings by 6.67%, which is the average rate on an AAA bond from 1990 to 2011.”(6)
When we first created our model, we settled on a 7.8% discount rate, slightly lower than the direct borrowing costs for student loans.
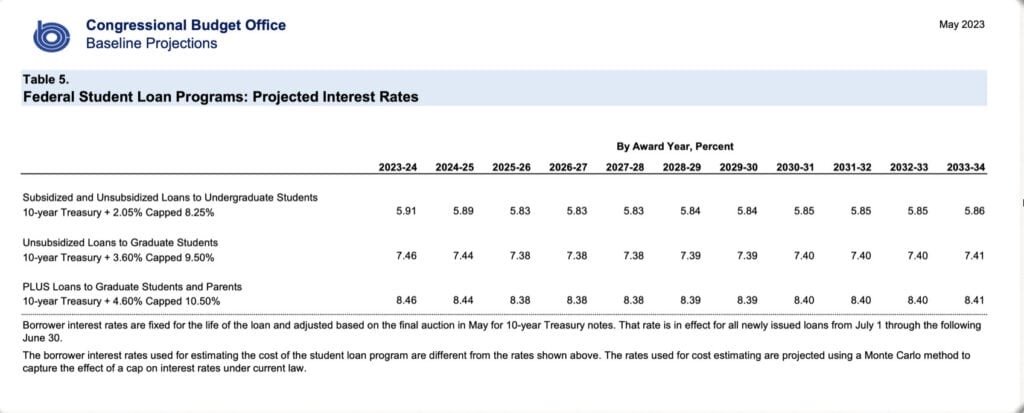
You may have noticed that we use parental interest rates rather than student rates. That is because student borrowing is somewhat limited, and public market borrowing is significantly higher than guaranteed federal rates shown here. As you can see above, the CBO projects those rates higher, but we recommend leaving the model assumption unchanged.
A high discount rate reduces the impact of later earnings in the model. We feel that later divergences in earnings are likely unrelated to the college degree. Our approach prioritizes isolating the base value created by the college degree.
Summary
Every decision model makes assumptions. When grounded in reality, those assumptions can help decision-makers evaluate their relative choices effectively. While they may not be perfect, they can help identify what matters and what levers can be pulled to make better choices.
We designed our model with you, the student and parent, in mind, who are considering a crucial college investment. We made assumptions that, on balance, best reflect reality. We encourage you to use the model and test your assumptions.
Find your best choice using the model that best reflects your situation and the economic realities you will face. We encourage you to use ours or a similar model before undertaking a significant college investment (they all are, regardless of how much you pay out of pocket, because of the substantial opportunity cost).
Now, it’s your turn. Explore your college choice wisely.
Reference Sources
- U.S. Department of Education College Scorecard. ”College Scorecard.” Collegescorecard.Gov. Accessed July 14, 2024. https://collegescorecard.ed.gov.
- U.S. Department of Education College Scorecard. ”College Scorecard.” Collegescorecard.Gov. Accessed July 14, 2024. https://collegescorecard.ed.gov/data.
- Ma, Jennifer, and Matea Pender (2022), “Trends in College Pricing and Student Aid 2022, New York: College Board. © 2022 College Board. https://research.collegeboard.org/trends.
- U.S. Department of Education National Center for Education Statistics. ”Digest of Education Table 326.10 Graduation Rate.” Nces.Ed.Gov. Accessed July 14, 2024. https://nces.ed.gov/programs/digest/d23/tables/dt23_326.10.asp?current=yes.
- Federal Reserve Bank of New York. ”The Labor Market for Recent College Graduates – Distribution of Annual Wages.” Newyorkfed.Org. February 22, 2024. https://www.newyorkfed.org/research/college-labor-market#–:explore:wages.
- Daly, Mary C. “Is It Still Worth Going To College?” Research & Insights Economic Letter, no. 2014-13. Accessed July 14, 2024. https://www.frbsf.org/research-and-insights/publications/economic-letter/2014/05/is-college-worth-it-education-tuition-wages/.
- We encourage peer review of our model, which has brief explanations and sources identified for primary assumptions. We also include an excerpted data set from our May 2024 download in the spreadsheet for you to use. Please reach out to me directly, and I will be happy to send you a copy.