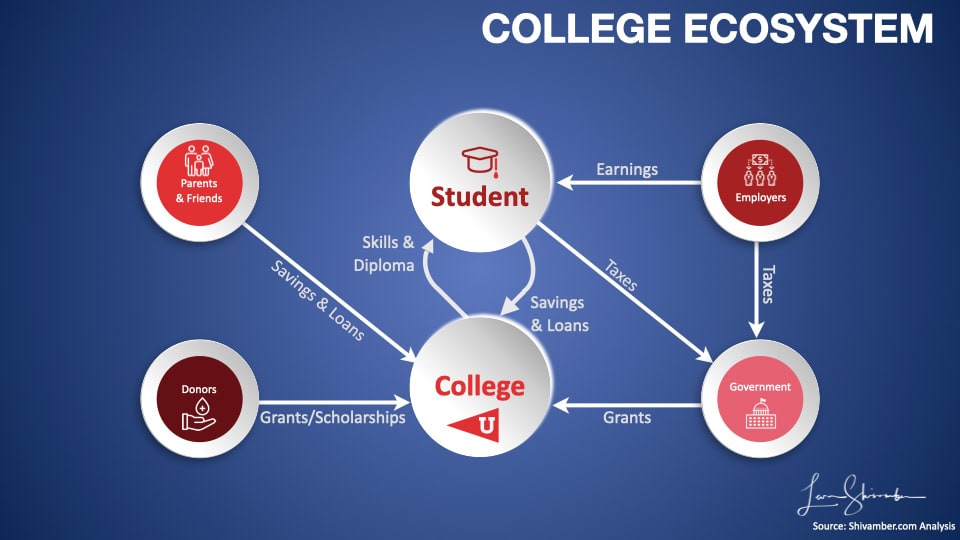
Considering the many parties involved, discussing a College Return on Investment can become complicated.
There are so many parties involved that when we talk about Return on Investment, we ought to clarify whose ROI we are talking about.
The return may be very different depending on who is being measured. Let’s explain.

“Each person does see the world in a different way. There is not a single, unifying, objective truth. We’re all limited by our perspective.”
Siri Hustvedt
The Investment Side
On the investment side are all those involved in paying for the full cost of attending college.
First – The Out-of-Pocket Costs
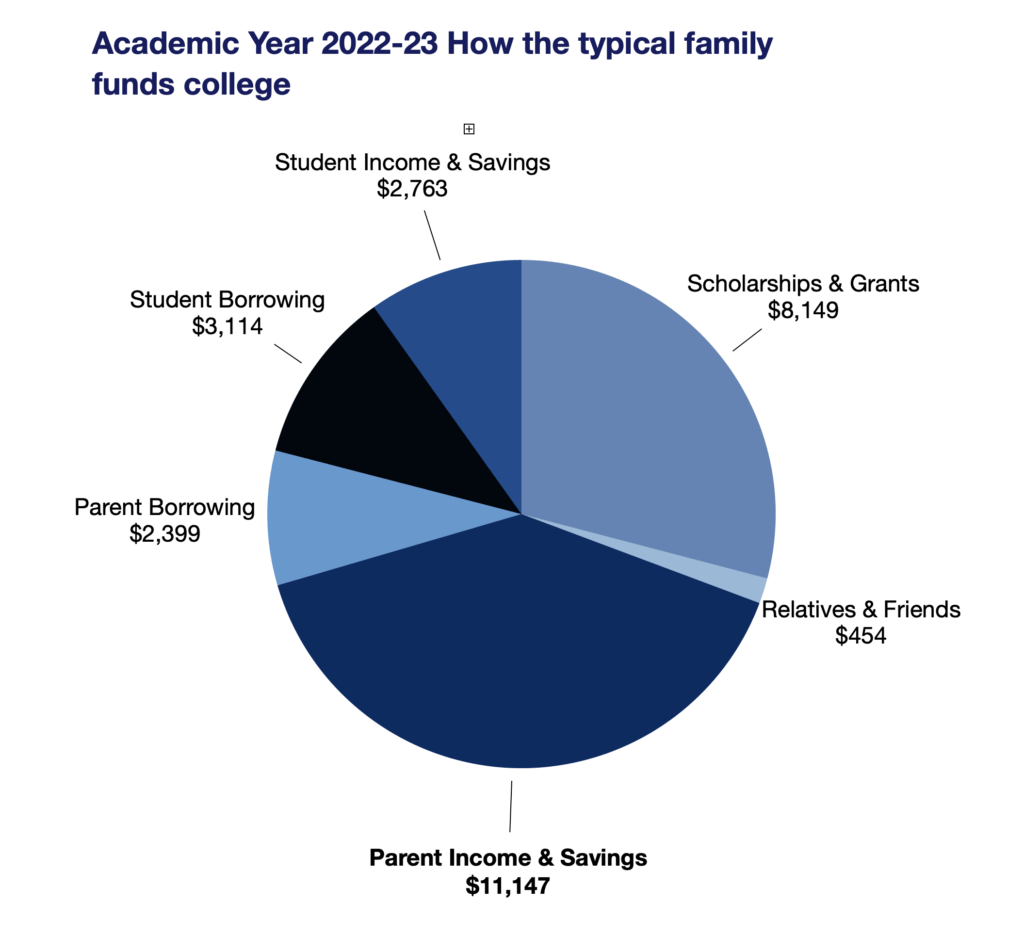
The Sallie Mae report How America Pays for College 2023 says, “Families spent an average of $28,026on College last year.”(16)
The primary party is the family. Parent Borrowing, Income, and savings accounted for $13,546 or 48% of the costs.
Student Borrowing, Income, and Savings represented $5,877 or 21% of total costs.
Scholarships and Grants of $8,149 were the majority of the rest (29%). This group is funded primarily by colleges, donors, and governments (state and federal). These costs are paid to your chosen institution, reducing the parents’ or student’s out-of-pocket expenses. But they are real costs nonetheless.
For completeness, we will treat a minor investment made by relatives and friends (2%) as being in the same category as donor or student borrowing.

Each of these groups, Parents, Students, Colleges, Donors, and the Government, makes investments in these degrees. The ROI is different from each group’s perspective because their return varies.
Second – The Opportunity Costs
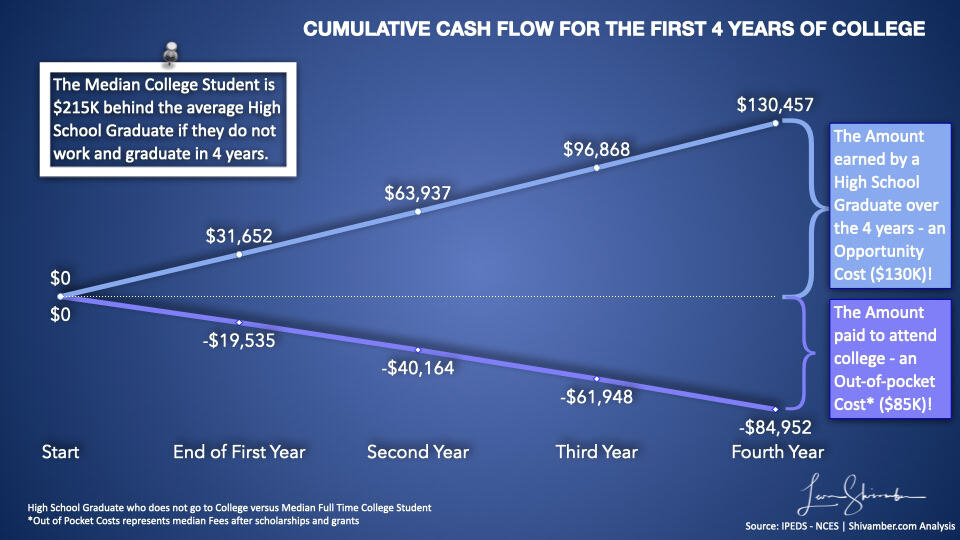
When choosing to attend college, the student gives up an opportunity to earn an income. While this opportunity is usually overlooked, it is a real value that must be overcome to make the college degree more valuable than attending high school.
Our estimate of opportunity costs is some $130k over four years. If the time to graduate is longer, then this cost grows.

We should subtract from this cost any income earned by the student while attending college. For our base models, we assume this is negligible as we are assuming a four-year time to graduation, which typically requires full-time attendance.
Let’s explore the returns from each perspective. In most cases, the majority of the return goes to the student. By return, we mean what value is created and passed back to the investor, the student, or society.
The Value Generated
The most obvious value created is the student’s salary over their lifetime. We can measure that, deduct costs and taxes when appropriate, and calculate the Net present Value.
There’s also the value of the Taxes paid. That is a social benefit that donors and the government might also be interested in.
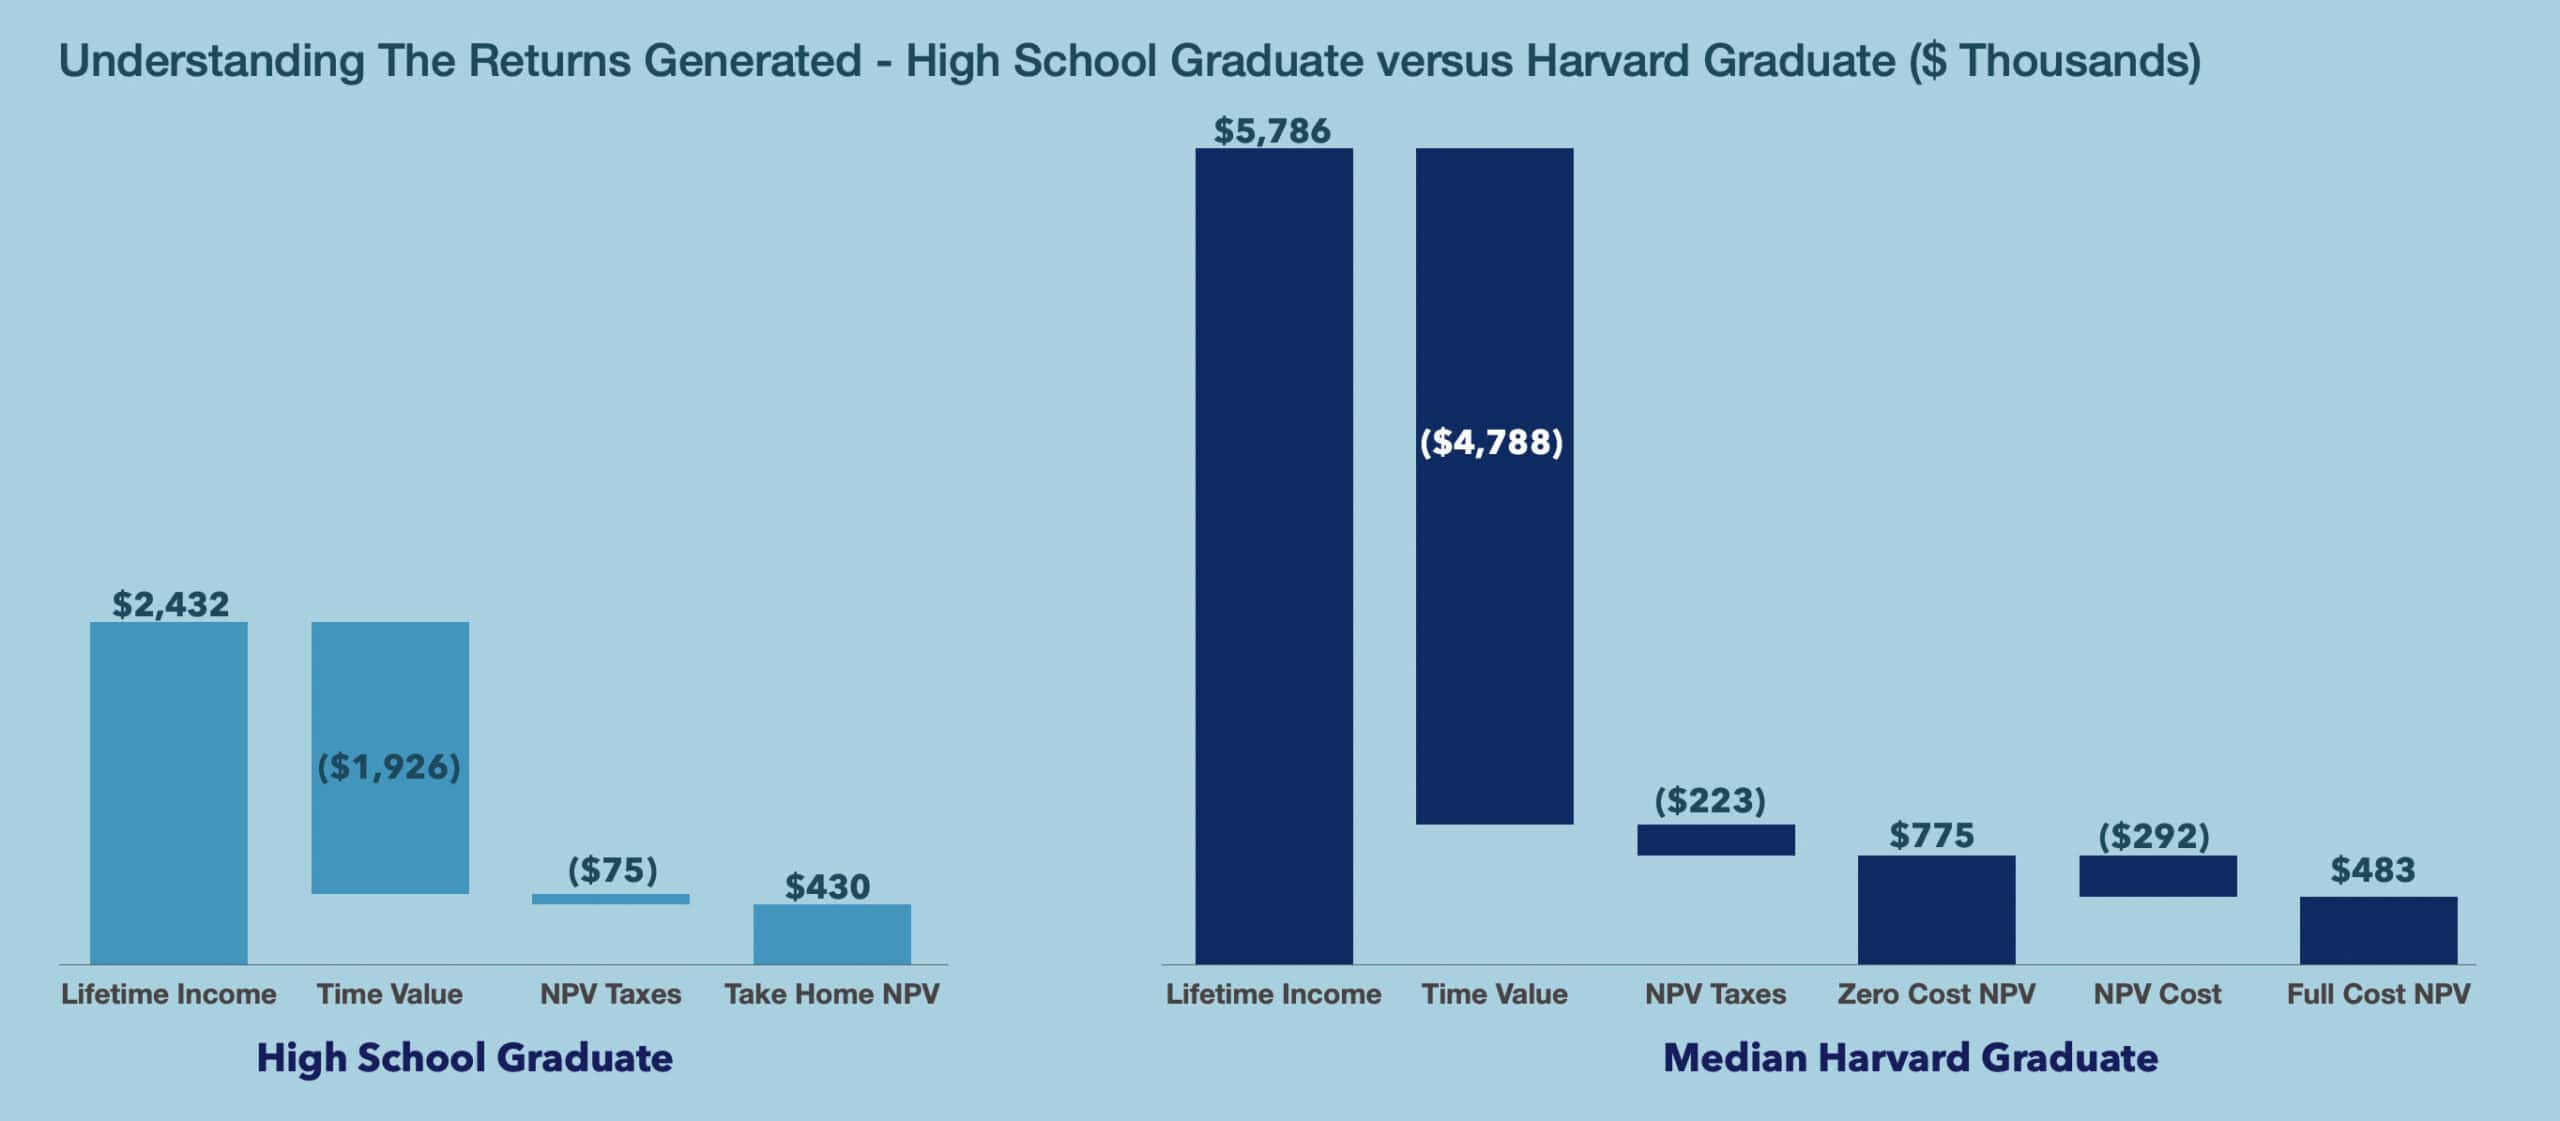
As we have mentioned before, the base case is the student leaving High School and going to work. This requires no additional investment and generates an NPV of $430k in Lifetime Earnings after Taxes. In addition, some $75k in NPV of Taxes is generated for society.
When investors fund college degrees, it is with the expectation that the value created will exceed the High School value, and they willingly hand over their investment for that benefit. Thus, the investment funds the incremental value created over and above the value generated by a High School Graduate.
Depending on the investor, we can look at the total or incremental value generated to determine their real return.
Our Model Returns
In our model, we calculate four returns:
- The full cost return assumes the full costs are paid, using the average full costs provided for the specific college. We assume median earnings. This will be the lowest value because it assumes the highest cost.
- The median cost return. We assume the median net costs are paid, using the median costs provided for the specific college. We assume median earnings. The typical family will experience this return between the full cost above and the zero cost below.
- The zero-cost return. We assume a full scholarship covering all out-of-pocket costs to attend. Considering the median salaries of the chosen field of study/institution, this is the most significant value expected.
- The expected cost return. This is based on their college choice, field of study, and the projected costs based on the student’s financial circumstances. The out-of-pocket cost includes grants and scholarships, but excludes loans. The student may also adjust their expected earnings above or below the median of the field of study/institution. If the median salary expectation is used, the value will fall between full and zero cost returns.
Student Returns
The student’s return is always the value of their take-home salary minus the costs they are responsible for.
It’s clear that students always receive the Net present Value of their lifetime earnings after taxes. However, what should we deduct from that to get their Net Value Created?
There are three variations that we need to consider:
- Zero Cost Return. When someone other than the student pays the bill. In this case, the family pays the full bill, or scholarships and grants cover the bill. This is likely the most common case, as wealthy and well-off families cover the full costs of attending college. For financially challenged or academically superior students, where the fees are covered by government grants and scholarships, the student receives the full return. In the chart below, the Harvard graduate zero cost return is $775k and is much higher than the benchmark High School return of $403k.
- The Full Cost Return. When the Student pays the full cost using their income, savings and borrowings. In the chart below, the Harvard graduate zero cost return is $483k and is higher than the benchmark High School return of $403k.
- Median Cost Return or Expected Cost Return. The Student funds a part of their cost, either the medium or a specific assumed cost. In this case, the student return is somewhere between the first two based on the proportion of the cost they picked up.

Family Returns
The family return is the student value minus the costs the parents are responsible for. It is usually less than the student’s return. The difference is a wealth transfer from the parents to the student.
Let’s use an example where the parents pay the full cost of their student attending Harvard. In this case, the student’s return is $775k. The parents’ return is a loss of $292k, the present value of the four years of cost to attend Harvard. The Family return is the sum of the two, or $483k.
When a student attends College and others pay a portion of the cost that the student does not have to repay, then that student receives a wealth transfer. A gift, which they get to keep.
Few economic researchers have factored in these wealth transfer and their effects on parents’ financial situations. Consider for a moment where the family is paying the median or full costs, and the child is attending one of those institutions where the median starting salary is below the break-even point at Zero Cost. In those cases, a wealth transfer occurs, the parents and others contribute to the student attending college, and the student is worse off than a high school graduate. In those cases, any grant, scholarship, parent, or student funds are losing money.
Donor Returns
The Donor return is slightly different. Let’s use another example and assume the donor funds the full scholarship. Here, the student gets a zero-cost return. However, the donor also finds the taxes accruing to society valuable. In the Harvard case, the donor is interested in the $775k plus the $223k for a total return of $998k. However, the Donor invests for the incremental benefit over the high school alternative. That incremental is $998k minus the $505k (($430 plus $75k) or $493k.
The donor’s investment is for four years of college costs. Let’s use the NPV of $292k. We can assume the donor is in the 37% tax bracket, and their net investment is only $184k, generating a return of 167% over the net investment.
Government Returns
The Donor return is also different. Let’s also assume the government is funding the full scholarship. The same return will be applicable if it only funds a portion of the costs, as it will only be measured against a portion of the benefits.
In this case, the government generates an approximately incremental $241k of taxes. This is higher than the example shown because we use a lower discount rate of 5.4%, the current government funding rate, to reflect the lower risk for government returns. Therefore, the return on its $292k investment is a loss of 18%.
Measuring the College
The college always extracts the full cost from society from various sources. It delivers to society the incremental value similar to donors’ $493k. The $292k received results in a 68% return over the original investment for Harvard. The median college is 72% return!
Reference Sources
- U.S. Department of Education College Scorecard. ”College Scorecard.” Collegescorecard.Gov. Accessed July 14, 2024. https://collegescorecard.ed.gov.
- U.S. Department of Education College Scorecard. ”College Scorecard.” Collegescorecard.Gov. Accessed July 14, 2024. https://collegescorecard.ed.gov/data.
- Ma, Jennifer, and Matea Pender (2022), “Trends in College Pricing and Student Aid 2022, New York: College Board. © 2022 College Board. https://research.collegeboard.org/trends.
- U.S. Department of Education National Center for Education Statistics. ”Digest of Education Table 326.10 Graduation Rate.” Nces.Ed.Gov. Accessed July 14, 2024. https://nces.ed.gov/programs/digest/d23/tables/dt23_326.10.asp?current=yes.
- Federal Reserve Bank of New York. ”The Labor Market for Recent College Graduates – Distribution of Annual Wages.” Newyorkfed.Org. February 22, 2024. https://www.newyorkfed.org/research/college-labor-market#–:explore:wages.
- Daly, Mary C. “Is It Still Worth Going To College?” Research & Insights Economic Letter, no. 2014-13. Accessed July 14, 2024. https://www.frbsf.org/research-and-insights/publications/economic-letter/2014/05/is-college-worth-it-education-tuition-wages/.