Solving higher education challenges involves several steps. The first is reaching an agreement on the significant issues to be addressed.
In earlier chapters, we examined the details and showed significant gaps between what is believed about and what actually happens in higher education.
Here we want to turn to another pressing challenge, perhaps one of the biggest roadblocks to higher education transformation – the ubiquitous use of low expectations.
Everywhere we look, we find no measures of quality or such low thresholds that they are of no value in galvanizing improvements.
In this article, I will explore these low exceptions and how we got there, and propose new ways to think about responsibility for improving education in the USA.
“The greater danger for most of us lies not in setting our aim too high and falling short; but in setting our aim too low, and achieving our mark.”
Michelangelo
- The latest example – Earnings
- The New Rule
- New Metrics
- Responses to the New Rule
- Setting low expectations
- Why State Benchmarks?
- State Benchmarks Are Too Low
- Our Earnings Benchmark
- Another Example – Graduation Rates
- How we got the graduation rates standard
- Graduation Rate Performance
- Our Proposal on Responsibility
- Reference Sources
- Read More In This Series
The latest example – Earnings
The DOE introduces new accountability rules (34 CFR Parts 600 and 668) that will be effective in July 2024. (1)
The “college is good even if you don’t finish” crowd is having heartburn over some of the guidelines.
The new rules propose measuring institutions against a benchmark and identifying those that are below it. They even propose limiting access to federal funds if some schools are below the benchmarks for too long.
What is this extreme rule you ask?
The New Rule
The rules come about from modifications to two parts of the law.
In subpart Q, DOE establishes a financial value transparency framework. That framework, essentially a set of metrics, they say, will increase the quality and availability of information directly provided to students about the costs, sources of financial aid, and outcomes of all eligible programs.
The second part, subpart S, establishes an accountability and eligibility framework for gainful employment programs (GE programs). This framework is targeted at specific educational programs that provide training that prepares students for gainful employment in a recognized occupation or profession (GE programs). GE programs include nearly all academic programs at for-profit institutions of higher education and non-degree programs at public and private nonprofit institutions such as community colleges.
The GE program eligibility framework will use the same earnings premium and debt-burden measures from the transparency framework to determine whether a GE program remains eligible for federal funding under Title IV, HEA participation.
In essence, the DOE wants to introduce a few quality financial metrics and reduce or stop funding schools that underperform those metrics.
This is a good idea, depending on the metrics, right?
So what are these metrics?
New Metrics
Each college will measure its graduates’ median earnings three years after graduation.
Each school will be measured against a market salary benchmark. If the school has 50% or more students from a particular state, then the benchmark is the state mean high school wage (as published by the census bureau). If more than 50% of the students are from other states, then the benchmark is the national median high school wage.
Schools’ median graduate earnings must exceed the state median high school graduate earnings as measured by the Census Bureau. If the school has more than 50% of its students from outside that state, then the benchmark will be the national median high school earnings.
The DOE estimates 5% of institutions will fail the measure.
Education supporters are up in arms over these rules.
Responses to the New Rule
The American Association of Cosmetology called the proposed rule illegal. (2)
In it’s 13 page response letter signed by it’s President Ted Mitchell, and on behalf of more than 45 major education associations, the American Council on Education says: “In determining how many GE programs would fail either the D/E or EP rate, we found that 26 percent of programs at Historically Black Colleges and Universities (HBCUs), 27 percent of programs at Minority-Serving Institutions (MSIs), 19 percent of programs at public institutions, and 36 percent of programs at private nonprofit institutions would fail. Of the non-GE programs that could fail either the D/E or EP rate, we found that 33 percent of programs at HBCUs, 8 percent of programs at MSIs, 6 percent of programs at public institutions, and 11 percent of programs at private nonprofits would fail.”(3)
The National Association of Student Financial Aid Administrators says: “Finally, it is inappropriate and illogical to use GE metrics for non-GE programs. Research shows the return on investment (ROI) of many non-GE programs — including liberal arts degrees — is higher over a lifetime, but has a longer time horizon than other programs. The GE metrics are designed to measure short-term ROI. This is appropriate for programs that provide training in a specific field, but not for a broader education that provides more readily-transferable critical thinking skills necessary to solve problems, adapt, and lead as the world changes. Neither type of education is better, but they are different, as evidenced by the fact that they are defined differently in statute.”(4)
Brookings Institute writers suggest that the median high school wages for blacks in the states where HBCUs operate are lower than state averages. They suggest that a lower benchmark may be more appropriate for HBCUs and that a similar reconsideration may be necessary for other similarly affected schools. (5)
There are other suggestions on methods for reducing the threshold.
There were supportive comments, too, but the gist of the pushback was that the rules were too tough because the thresholds were too high. Let’s explore that.
Setting low expectations
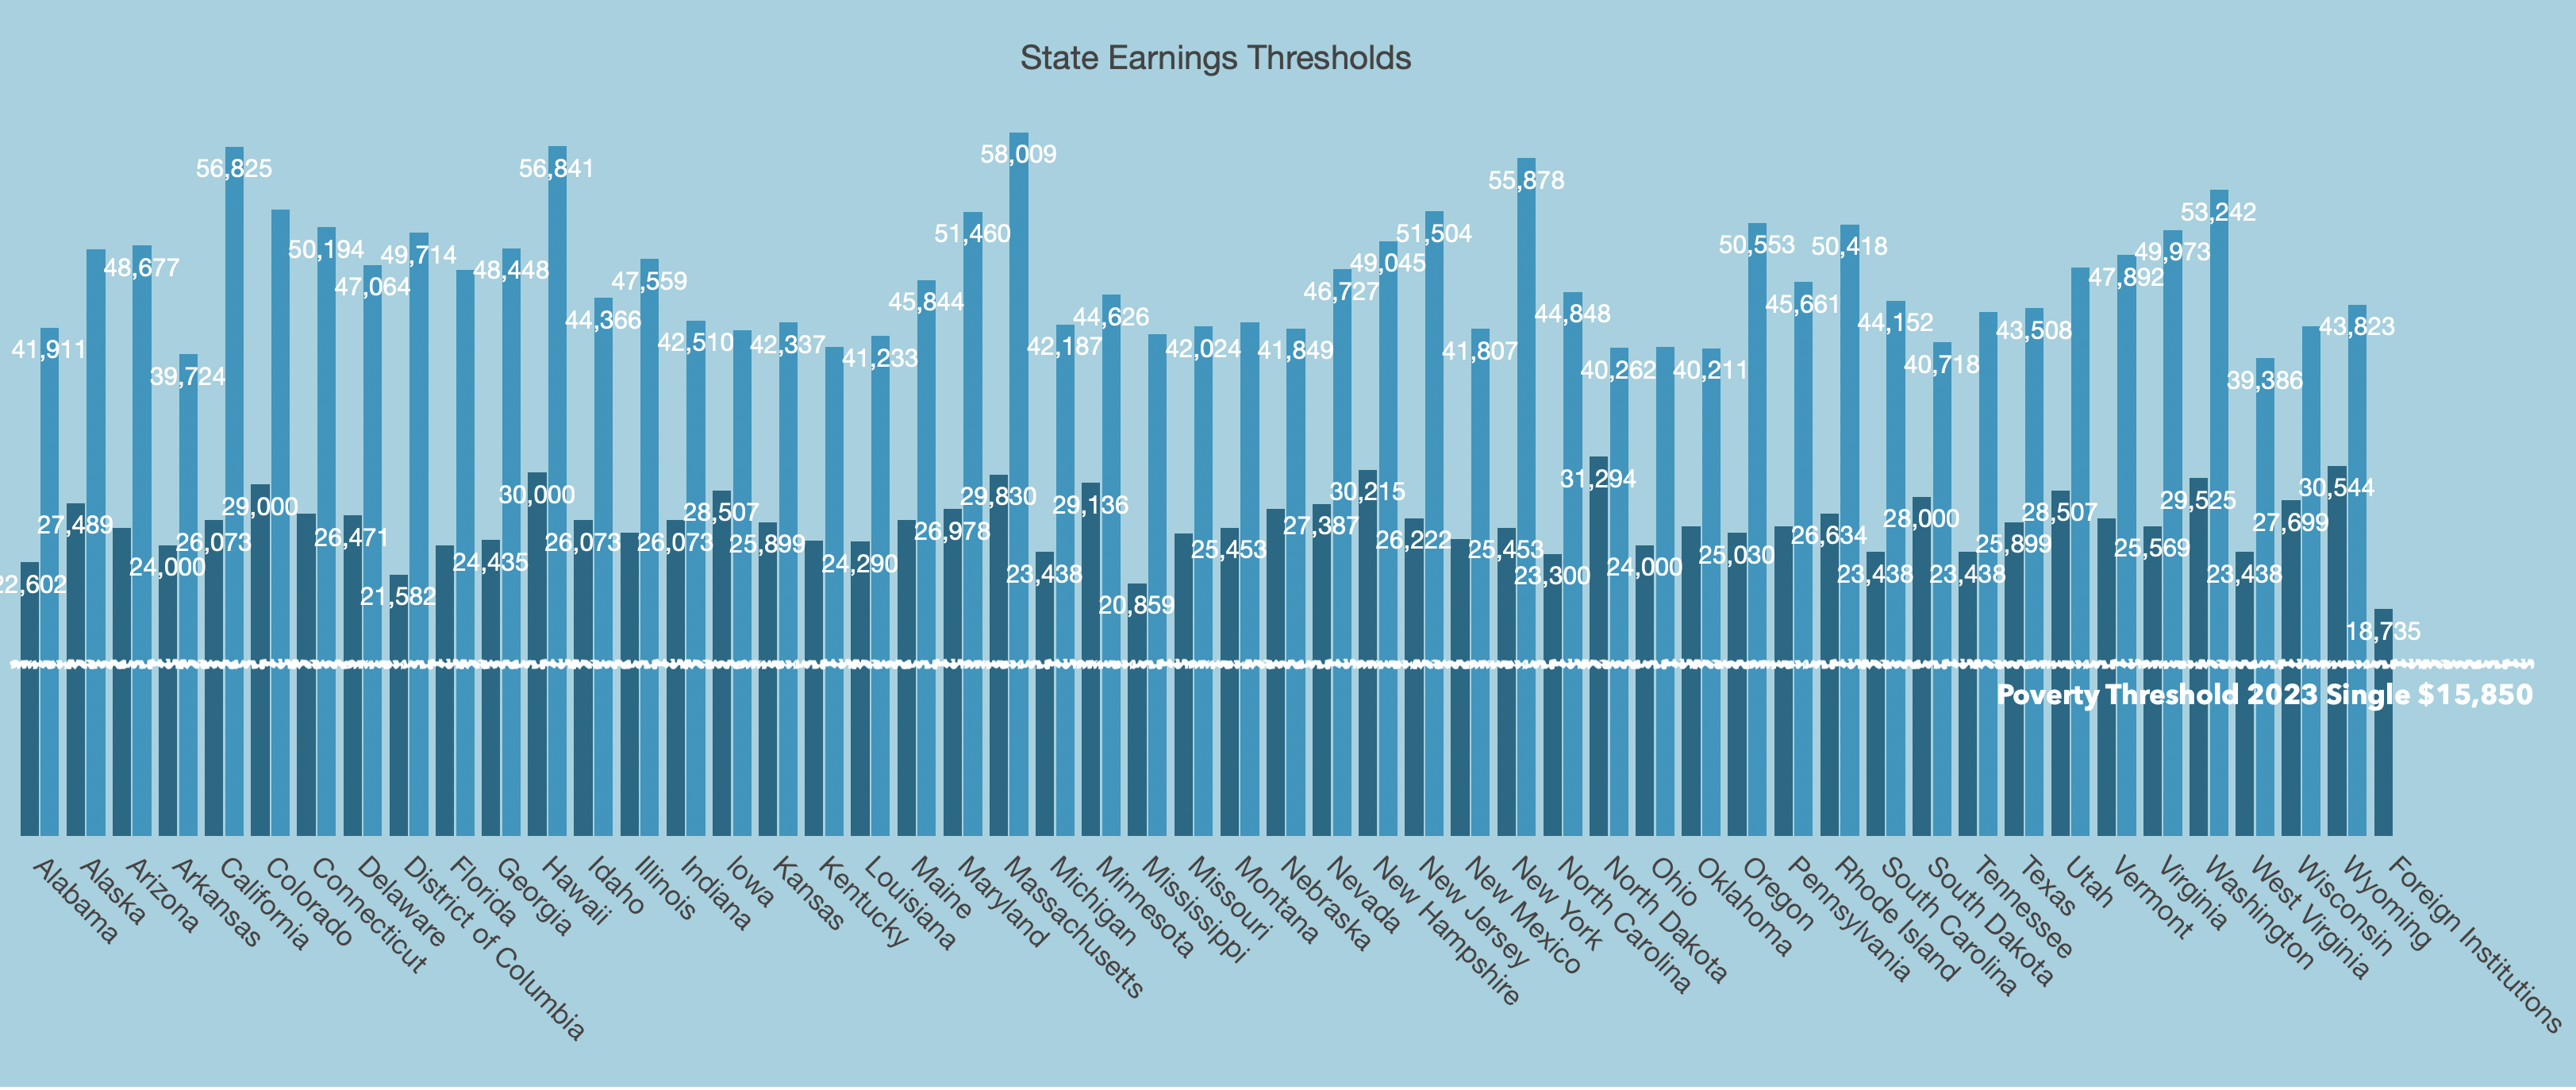
Let’s start with the student salary benchmarks. It’s the state median high school wage as measured by the census. The Earnings Threshold ranges from $31,294 (North Dakota) to $20,859 (Mississippi). The threshold for institutions in U.S. territories (other than Puerto Rico) and outside the United States is $18,735.(1)
I will return to discuss why this is an inappropriately low benchmark, but let’s first address the other side of the comparison.
On the other hand, an institution must measure student median wages to compare against the benchmark. The applicable student wages are measured three years after graduation.
The DOE estimates the average age of students three years after completion for undergraduate certificate programs is 31 years, while for Associate’s programs it is 30, Bachelor’s 29, Master’s 33, Doctoral 38, and Professional programs 32. There are very few Post-BA and Graduate Certificate programs (162 in total), and their average ages at earnings measurement 35 and 34, respectively. (1)
For an institution to fail this metric means that 50% or more of the students graduating are still making no more than the median high school graduate!
Does anyone believe students are better off if they are in their 30s and making the same wages as the median high school graduate in their state?
When will the student earn a premium to pay back for any of the costs they incurred to get that degree? That does not even consider the earnings foregone by attending the institution.
An institution where 50% of the graduates are losing money is a failure. It should not receive federal funding, federal loans, or donor support!
Why State Benchmarks?
Why is the federal government using state benchmarks to set standards of quality?
The IRS does not differentiate between states when setting tax rates. If you are married filing jointly, anything earned up to $23,200 gets a 10% tax, in addition to the social security and Medicare taxes. This is no questions asked and independent of the minimum wages, median high school graduate wages, or any other benchmark for a specific state.
If anything, the shifting benchmark for quality obfuscates the gap from a national standard and makes it harder to compare institutions’ quality.
The DOE does not use state benchmarks to determine the amount of Pell grants provided or the amount of federal loans a student is eligible for. It compares the cost of the institution with the ability to pay. The maximum Pell grant is the same in every state.
State Benchmarks Are Too Low
The Census Bureau estimates that the level below which one is considered in Poverty, the Poverty Threshold, for a single person, is $15,850 as of 2023.
Below, you can find the median high school wages as of 2019, which are the data provided by the DOE in June 2023, serving as state benchmarks. The State of Mississippi shows the lowest benchmark at $20,859. Should we really consider a college delivering on the promise of a better life if 50% of its graduates, in their 30s, are experiencing annual wages $5 thousand more than the poverty threshold?
Keep in mind that the census data is usually dated. The example here is shown for 2019, while this is being written five years later. The median high school wage for students ages 22-25 is closer to $36k at the national level.
We also show the estimated living wage for a single person in each state, which is a much better estimate of what is required to cover the standard cost of living in each state. In Mississippi, that number for a single person is $41,361.(6)

Many individuals nearing 30 may already have a family with a child. Those living wages will be dramatically higher.
Our Earnings Benchmark
We know that for a college graduate, just matching a high school graduate’s wages is not enough to break even with a high school graduate’s lifetime earnings. That is because the college student needs to pay back the cost of attending college and make up for the wages foregone while there (the opportunity cost).
These costs are paid back over time and from after-tax receipts. Thus, from our models, when a high school graduate’s benchmark is $36k, we estimate the salary must be closer to $50k to breakeven. That assumes the student did not have to pay anything to attend college. Most students incur some costs, and those drive the breakeven benchmark higher.
Colleges will continue to produce students who generate subpar returns on their investments, even with the low threshold that the DOE is having trouble implementing.
For colleges to deliver value to students, we need to raise these unjustifiably low benchmarks. Grants and loans for degrees that deliver less will cost the student, their family, donors, and the government money!
Another Example – Graduation Rates
The Department of Education’s College Scorecard shows graduation rates for every institution. On its page for Harvard, it shows that its graduation rate is 98%, and the midpoint of four-year colleges is 58%.
If you click on the details, you find the following explanation:
“Graduation rate is presented differently for degree granting and non-degree granting schools.
The graduation rate for degree granting schools is the proportion of entering students that graduated at this school within 8 years of entry, regardless of their full-time/part-time status or prior postsecondary experience. Graduation is measured 8 years after entry, irrespective of the award sought or award obtained.
The graduation rate for non-degree granting schools is the proportion of full-time, first-time students that have graduated at the same school where they started college within 150% of normal program completion time (e.g., within 6 years for a bachelor’s degree, or within 15 months for a 10-month certificate).”
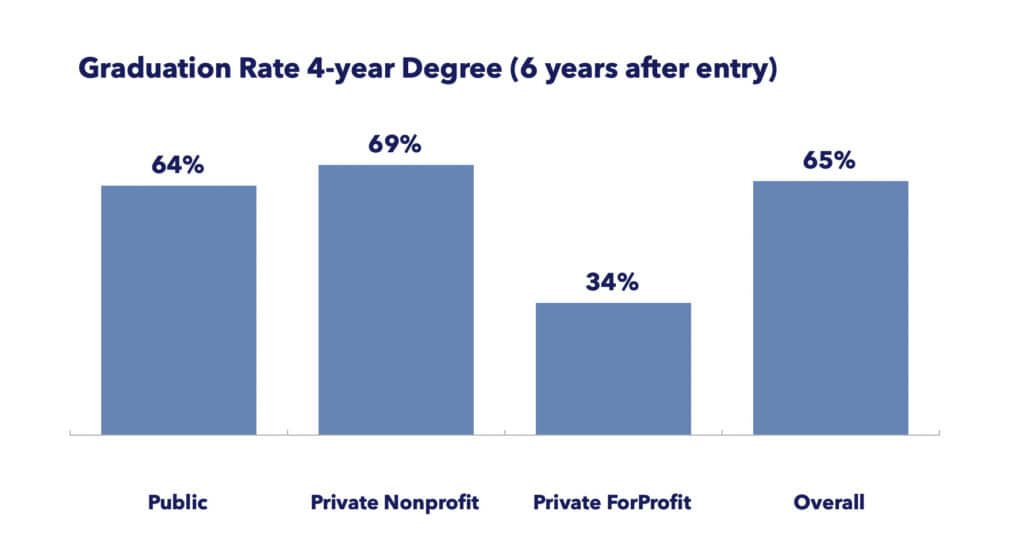
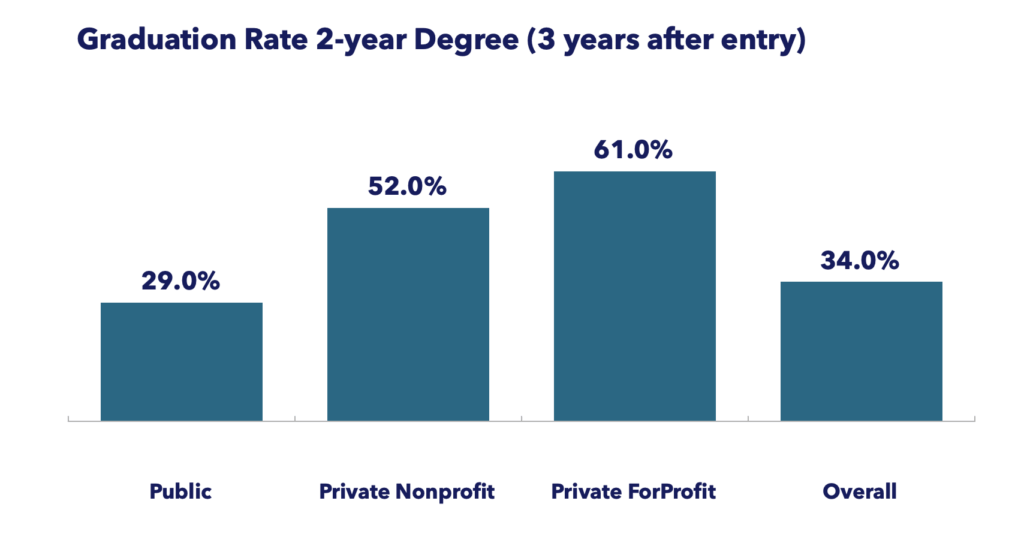
The DOE by law collects 150% of normal completion time rates. That means six-year graduation rates for four-year degrees and three years for Associate degrees, but publicizes the much more liberal metric on their most easily accessed website.
How we got the graduation rates standard
Retired Senator Bill Bradley of New Jersey ran for the Democratic Party nomination for President in 2000. He lost to Al Gore. He was a Rhodes Scholar who studied at Oxford. He was also an accomplished basketball player, in fact, he was considered the best player in the country as he considered college. He won a gold medal with the 1964 Olympic Basketball team. He was the most outstanding player in the 1965 NCAA Basketball tournament. he played in the NBA for the New York Knicks. He was named to the Basketball Hall of Fame in 1983, six years after retiring. (7)
Bill Bradley is an accomplished leader. During his NBA career, he used his fame on the court to explore social and political issues, and that continued in his political career.
Bill was always concerned about the state of athletics in colleges. He was particularly concerned that many athletes were playing in college but not graduating. Worried about colleges “single-minded devotion to athletics”, in 1989, he joined a couple of other star athletes in Congress to call for colleges to publish graduation rates of their student athletes. (8)
Bill was concerned that few athletes ended up in professional sports, and he wanted them to at least graduate. Measuring graduate rates would inform incoming athletes of the underlying performance of their chosen program.
Until then, colleges did not publish graduation rates.
The proposal gained traction. The original proposal was to measure graduation rates in five years, because athletes had a five-year eligibility period. However, other senators saw the value in such a rule and wanted it applied more broadly than just to athletics. They wanted schools to report graduation rates broadly.
Senator Kennedy, who coauthored bill S.2498, referred to as the Student Athlete Right-to-Know Act, represented Massachusetts, a state with many renowned higher education institutions. He recommended, and they eventually settled on a measure of 150% of the normal degree time. So four-year degree graduation rates are measured in six years, and two-year associates in three years.(9)
The law was passed in 1990. The first year the Department of Education collected the data was 1996. (10)
That is how we began to get graduation rates, and why 34 years later, the Department of Education publishes six-year graduation rates for four-year degrees, and three-year graduation rates for two-year degrees.
Graduation Rate Performance
Leaving aside the question of the low standards set by displaying 8-year graduation rates on its website or measuring four-year degrees against a six-year standard, how do we perform as a nation?
The graduation rate for students earning a four-year degree within four years is a stunningly low 44.1% to 49.1%.(11,12)


We will let you decide whether you think these standards and performance are low or appropriately set.
Our Proposal on Responsibility
We want U.S. Colleges and Universities to be global leaders and serve our communities well. That means a performance-oriented strategy with appropriate goal setting.
All of our leaders have a role to play in the continuous improvement of our education system:
- Local Leaders. Measure your local institutions rigorously and set goals to reach state benchmarks at a minimum.
- State Leaders. Drive underperformers in your state to state benchmarks, but set goals to exceed national standards.
- National Leaders. Drive underperforming states to national benchmarks, set goals to be global benchmarks.
We do not believe our system should shield the low performers with woefully inadequate standards. Instead, we envision a system where high expectations, like a powerful magnet, constantly seek to pull the rest of the field upwards!
Reference Sources
- Department of Education (2023, October 30). Docket ED-2023-OPE-0089-3917 Financial Responsibility, Administrative Capability, Certification Procedures, Ability to Benefit. Regulations.Gov. Retrieved July 25, 2024, from https://www.regulations.gov/document/ED-2023-OPE-0089-3917
- Department of Education (2023, October 30). Docket ED-2023-OPE-0089-3917 Financial Responsibility, Administrative Capability, Certification Procedures, Ability to Benefit. Regulations.Gov. Retrieved July 25, 2024, from https://www.regulations.gov/comment/ED-2023-OPE-0089-3073
- https://www.acenet.edu/Documents/Comments-ED-May-2023-NPRM-062023.pdf
- https://www.nasfaa.org/uploads/documents/NASFAA_Comments_Gainful_Employment.pdf
- Startz, D. (2023, July 25). Proposed earnings premium benchmarks threaten HBCUs. Brookings.edu. Retrieved July 25, 2024, from https://www.brookings.edu/articles/proposed-earnings-premium-benchmarks-threaten-hbcus/
- Amy K. Glasmeier, “Living Wage Calculator,” Massachusetts Institute of Technology, 2024. Living wage data sourced from the Living Wage Institute via https://livingwage.mit.edu/Accessed on May 9, 2025.
- Bill Bradley. Accessed on July 25, 2024. In Wikipedia. https://en.wikipedia.org/wiki/Bill_Bradley
- Davis, Kevin. “Senator Urges Approval of Bill to Tell Recruits Graduation Rates.” Latimes.Com. Los Angeles Times, September 13, 1989. https://www.latimes.com/archives/la-xpm-1989-09-13-sp-2105-story.html.
- Marcu, Jon. “Most College Students Don’T Graduate in Four Years, so College and the Government Count Six Years as “Success”.” Hechingerreport.Org. The Hechinger Report, October 10, 2021. https://hechingerreport.org/how-the-college-lobby-got-the-government-to-measure-graduation-rates-over-six-years-instead-of-four/.
- Cook, Bryan, and Natalie Pullaro. “College Graduation Rates: Behind the Numbers.” Acenet.Edu. American Council on Education Center for Policy Analysis, September 2010. https://www.acenet.edu/Documents/College-Graduation-Rates-Behind-the-Numbers.pdf.
- U.S. Department of Education National Center For Education Statistics. ”Time To Degree Fast Facts.” Nces.Ed.Gov. Accessed July 27, 2024. https://nces.ed.gov/fastfacts/display.asp?id=569.
- U.S. Department of Education National Center For Education Statistics. ”Digest of Education – Table 326.10.” Nces.Ed.Gov. Accessed July 27, 2024. https://nces.ed.gov/programs/digest/d23/tables/dt23_326.10.asp.