IHEP says 83% of American Colleges exceed Threshold 0 and therefore generate a beneficial return to college graduates above that of a high schooler. Does this research hold up?
“Statistics can be so misleading. It is funny, though, how often at the moment you see one team had 60 per cent of the ball but still lost.”
Neil Warnock
- Introduction to IHEP and the “Rising Above the Threshold” Report
- What is Threshold 0?
- Where could IHEP improve?
- Does IHEP reach the wrong conclusion?
- Massachusetts Research Counters IHEP Conclusion
- Does Passing Threshold 0 Deliver A Good College Return?
- Conclusion
- Reference Sources
- Read More In This Series
Introduction to IHEP and the “Rising Above the Threshold” Report
The Institute for Higher Education Policy (IHEP) is a well-regarded, nonpartisan nonprofit organization founded in 1993. It is known for its impactful research on higher education inequities. IHEP’s mission is to promote access to and success in higher education, especially for underserved communities, and its reports often shape policies at federal, state, and institutional levels.

One of its most significant recent works is the 2023 report, “Rising Above the Threshold: How Expansions in Financial Aid Can Increase the Equitable Delivery of Postsecondary Value for More Students.”1 Since its release, this report has become a widely cited resource for evaluating the economic value of college education, influencing discussions among policymakers, educators, and students.
The report introduces Threshold 0, a benchmark developed by IHEP’s Postsecondary Value Commission, a group of 30 diverse leaders from the education, business, and policy sectors. The Commission aimed to define postsecondary value, measure it, and advocate for equitable improvements.
Threshold 0 represents the minimum economic return a student should expect from college, specifically, earning at least as much as a high school graduate in their state plus enough to recover the total net price of their education within ten years of starting college.
IHEP’s analysis claims that 83% of institutions (representing 93% of undergraduates) meet or exceed this threshold, suggesting that college is a financially worthwhile investment for most students compared to stopping at a high school diploma.
"At the majority (83 percent) of institutions, representing 93 percent of undergraduates, students receive at least a minimum economic return on their investment. In other words, students' typical earnings meet or exceed the Threshold 0 benchmark within 10 years of starting College. In these terms, nearly all public and private nonprofit institutions leave students better off financially in comparison to similar adults who did not pursue postsecondary education.”

Rising Above The Threshold
Threshold 0 is an innovative starting point, but it relies on several assumptions and overlooks key factors limiting its accuracy. Below, we’ll explain how Threshold 0 is calculated and then explore five critical areas where it falls short, drawing on a detailed critique to propose a more robust measure of college return on investment (ROI).
What is Threshold 0?
Threshold 0 is a metric that assesses whether a college education delivers a minimum economic benefit. Here’s how IHEP calculates it:
- High School Salary Baseline: IHEP uses the U.S. Census Bureau’s American Community Survey to determine the median salary of high school graduates in each state. The report shows an example of $28,297 for California.
- College Costs: They take the median net price (tuition minus grants and scholarships) for each college from the U.S. Department of Education’s College Scorecard, multiply it by an estimated time to degree completion (e.g., four years or more), and calculate the total cost of the education. Their example shows an institution with an annual net price of $18,500 for four years, equaling a total of $74,000.
- Repayment Calculation: This total cost is amortized over ten years to find the annual payment required to repay the investment. In their example, they use a 2.75% interest rate and 120 monthly payments (10 years) to get $8,472 per year.
- College Graduate Earnings: They use the median salary of college graduates ten years after enrollment, also from the College Scorecard. For their hypothetical college, they show median annual earnings at $45,750.
- Threshold 0 Test: A college meets Threshold 0 if the graduate’s median salary ten years after enrollment exceeds the sum of the state’s median high school salary plus the annual repayment amount. In their example, Threshold 0 for the hypothetical college is $36,769 ($28, 297 plus $8,472). The college student’s median salary of $45,750 exceeds Threshold 0.
In the IHEP example, the College student’s salary above Threshold 0 they claim means that this student will earn an economic return better than a high school graduate (in California).
IHEP’s finding that 83% of institutions pass this test paints an optimistic picture of college value, but a closer look reveals significant flaws.
Where could IHEP improve?
While Threshold 0 is a valuable framework, it makes several assumptions and omissions that undermine its reliability. Here are five key areas where it falls short, followed by detailed explanations:
- Reliance on State-Specific High School Salaries as baseline.
- Ignoring attendance cost inflation.
- Overlooking opportunity costs of attending College.
- Failure to account for the impact of taxes on earnings.
- Disregard for the time value of money.
Let’s explore each in more detail.
Reliance on State-Specific High School Salaries as Baseline
IHEP Threshold 0 sets the bar too low. It compares college graduates’ earnings to the median high school salary in the state where the institution is located.
However, graduates are not confined to working in that state. They often move elsewhere for jobs.
Using the state median salaries, the IHEP Threshold 0 only applies to the state in which the institution operates.
A degree might meet Threshold 0 in a low high-school salary (e.g., Mississippi) but fall short in a state with a higher baseline (e.g., Massachusetts).
This state-specific approach limits the metric’s universality. A more practical benchmark would be the national median high school salary, providing a consistent standard across all institutions and better reflecting graduates’ mobility.
Ignoring Attendance Cost Inflation
IHEP Threshold 0 understates college costs. Threshold 0 assumes that college costs remain static over time, but historically, tuition and fees have risen much faster than general inflation.
While IHEP uses the median net price (after grants and scholarships), which grows more slowly than the sticker price, ignoring cost increases still overestimates the economic value of college, especially in the short term.
This assumption isn’t a major flaw since it’s applied consistently, but acknowledging cost inflation would make the metric more realistic, particularly for students facing rising expenses over their college years.
Overlooking Opportunity Cost
IHEP measures earnings ten years after enrollment, typically six years of work for a four-year degree (since the median time to graduate often exceeds four years).
During those college years, high school graduates earned a salary while college students did not, creating an opportunity cost that Threshold 0 ignored. For instance, if a high school graduate makes $30,000 annually, they’d have $120,000 after four years, money the college student didn’t earn.
Even if a college graduate meets Threshold 0 within ten years, they may not catch up to the cumulative earnings of a high school graduate who started working immediately.
An accurate measure of ROI should require college graduates to surpass the accumulated earnings of high school graduates, including this lost income.
Failure to Account for Taxes
Our federal tax system is progressive, taxing higher incomes at higher rates. Further, we pay college costs with after-tax dollars, with limited tax deductibility. IHEP’s model doesn’t adjust for this.
For example, a college graduate earning $80,000 might take home less than twice what a high school graduate earning $40,000 does after taxes. In our model, a high school graduate pays $400,000 in lifetime taxes, while a college graduate pays $600,000. That $200,000 extra tax shrinks the degree’s financial edge.
This tax burden disproportionately affects higher earners, yet Threshold 0 treats gross salaries as equivalent to disposable income.
A better metric is the net present value (NPV) of lifetime earnings after taxes and costs, reflecting students’ real economic benefit.
Disregard the Time Value of Money
Threshold 0 overlooks a core financial principle: the time value of money.
The time value of money is the principle that a dollar today is worth more than a dollar in the future due to its potential to earn interest. For instance, the money spent on college upfront could have been invested elsewhere.
Conversely, this principle means that earnings years later are worth less than today’s dollars.
By not discounting future earnings and costs to their present value, IHEP overstates the economic return of college.
This omission is critical for any investment analysis in which investments are made upfront, and the benefits accrue over an extended period. Incorporating it would align Threshold 0 with standard financial practices.
Ignoring it inflates Threshold 0’s perceived value.
Does IHEP reach the wrong conclusion?
IHEP’s goal, to define a minimum economic return for college, is commendable, but Threshold 0’s flaws lead to an overly optimistic conclusion. The claim that 83% of institutions deliver at least a minimum return doesn’t hold up under scrutiny when these factors are considered.
Moreover, other research supports our skepticism about Threshold 0. The Massachusetts Postsecondary Commission suggests the Threshold 0 optimistic conclusion does not hold up.
Massachusetts Research Counters IHEP Conclusion
In December 2021, the Massachusetts Postsecondary Commission released its report, Degree-Specific Earnings Outcomes of Graduates From Colleges in Massachusetts,2 revealing a stark contrast. It found that only 55% of degree programs, many at public four-year colleges, enabled graduates to outpace non-college peers and recoup costs within ten years, far below IHEP’s 83%. Worse, 26% of programs left graduates either worse off or needing over 20 years to break even.
“55% of degree programs in the Commonwealth, many of them in the state's public 4-year colleges, allow typical graduates to earn a lot more than they would have without college and to pay back the cost of college in less than 10 years from these added wages.”

"On the other hand, and this should be a cause for discussion, if not alarm, in 26% of degree programs in Massachusetts, typical graduates earn less than they would have if they had never gone to college, or they receive only a modest bump in wages from college and need 20+ years to recoup the cost of college."

Degree-Specific Earnings Outcomes of Graduates From Colleges in Massachusetts
Massachusetts, with one of the nation’s top higher education systems, shows a higher failure rate than IHEP’s national estimate, despite not factoring in taxes or the time value of money, which would likely worsen the results further.
Does Passing Threshold 0 Deliver A Good College Return?
IHEP says that Threshold 0 is the minimum required for a college graduate to earn a return better than a high school graduate. In essence, if the College graduate’s earnings ten years after enrollment exceed Threshold 0, they say that student would be better off than a comparable High School Graduate who did not attend college.
We have pointed out some deficiencies in the Threshold 0 model. To address these shortcomings, a better model would project costs and earnings over a working lifetime (e.g., to age 65), deduct taxes, and discount cash flows to calculate the net present value (NPV) of lifetime earnings after taxes and costs.
Let’s see if we can combine this and definitively answer whether earning more than Threshold 0 ten years after enrollment means a good college return. We will use our comprehensive model, which covers all the missing pieces.
We built our college investment model on rigorous research and objective data. Our data comes from government sources such as the U.S. Department of Education, the Census Bureau, the Bureau of Labor Statistics, the IRS, and the Federal Reserve. These sources provide comprehensive and reliable data on various aspects of college education and its economic implications.
Let’s see how our conclusion changes when we fix Threshold 0’s shortcomings. We will compare the median High School Graduate, the median College graduate, and the median Harvard Graduate.
As of May 2024, when we built our comprehensive model, the median salary (10 years after enrollment) at Harvard was $95,114. The median College graduate was at $50,806. We use the national median of $37,827 for the High School graduate. The Harvard Graduate and the Median College Graduate earnings are well above Threhold 0.
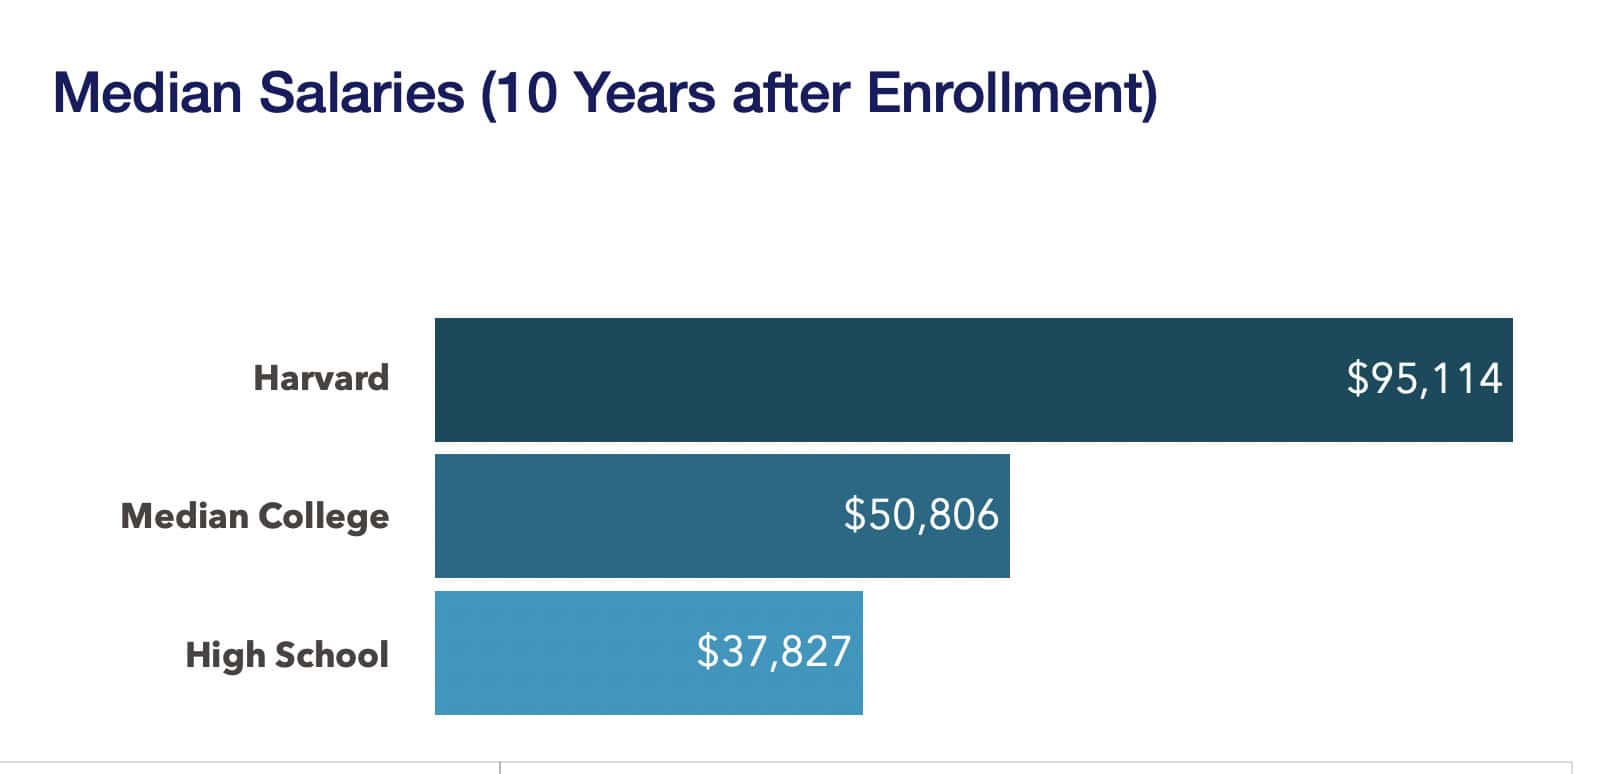
We use the appropriate median net price to attend each College, grow earnings over time, reflect federal taxes at 2024 rates, and then calculate the net present value of these.
From our reading of the IHEP work, it’s unclear when they assume the college return exceeds the High Schooler’s. Is it ten years after enrollment? Or over the lifetime? So, we will explore what happens in both cases.
Does Passing Threshold 0 provide a higher return Ten Years after Enrollment?
First, look at the cumulative earnings in those ten years, after costs but before taxes and time value adjustments. The college graduates have worked for six years, while the High Schoolers have worked for ten.
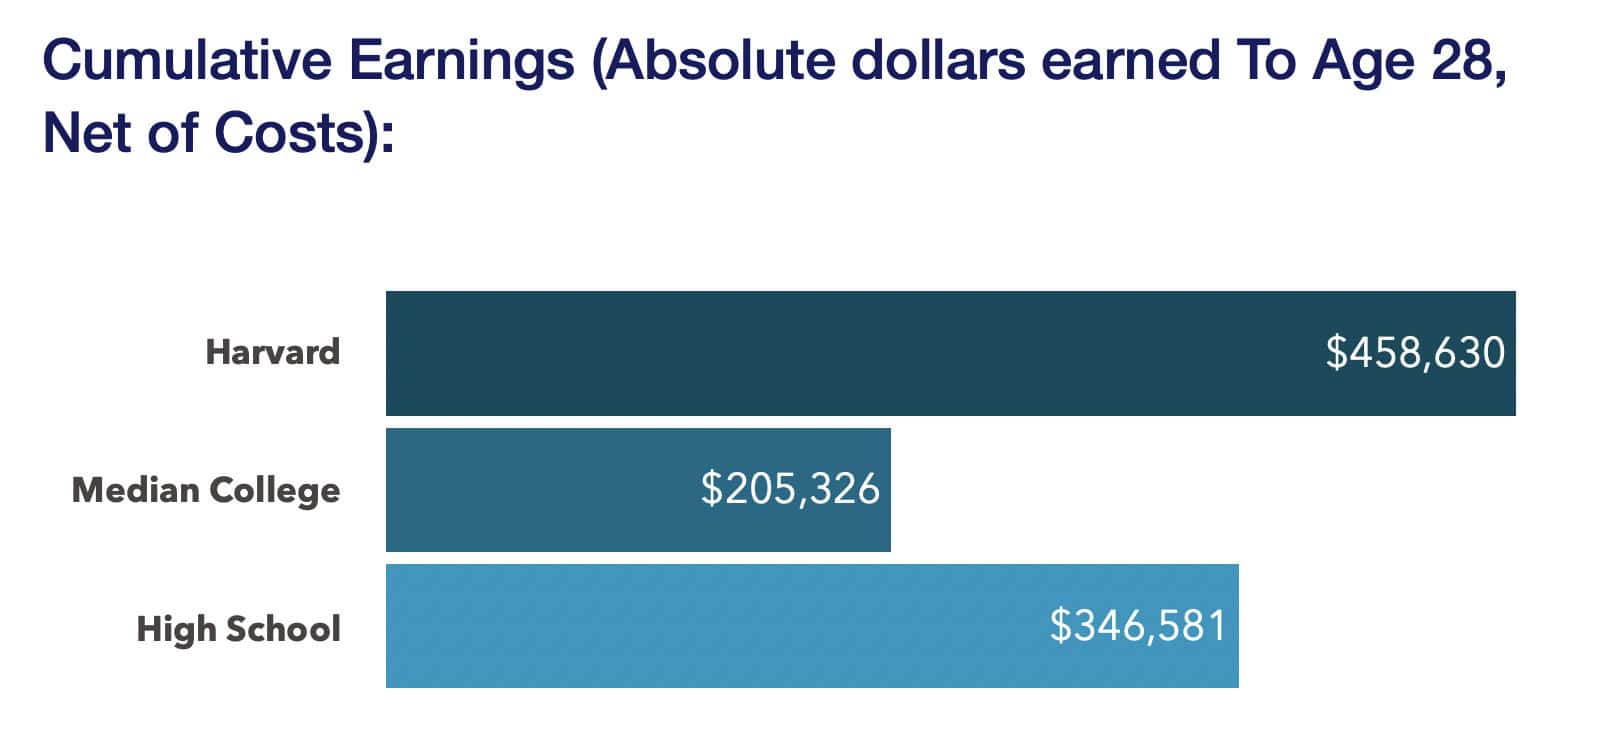
We find that the median Harvard graduate, at $458,630, has earned cumulatively after college costs more than the median high school graduate, who is at $346,581. However, the median College Graduate has only earned $205,326.
The median college graduate is far short of the goal of “earning at least as much as a high school graduate in their state plus enough to recover the total net price of their education within ten years of starting college.”
The claim that 83% of students earn enough ten years after enrollment to pay off their college costs and match a high school graduate is flawed.
It gets worse. Let’s look at what happens after we adjust for taxes.
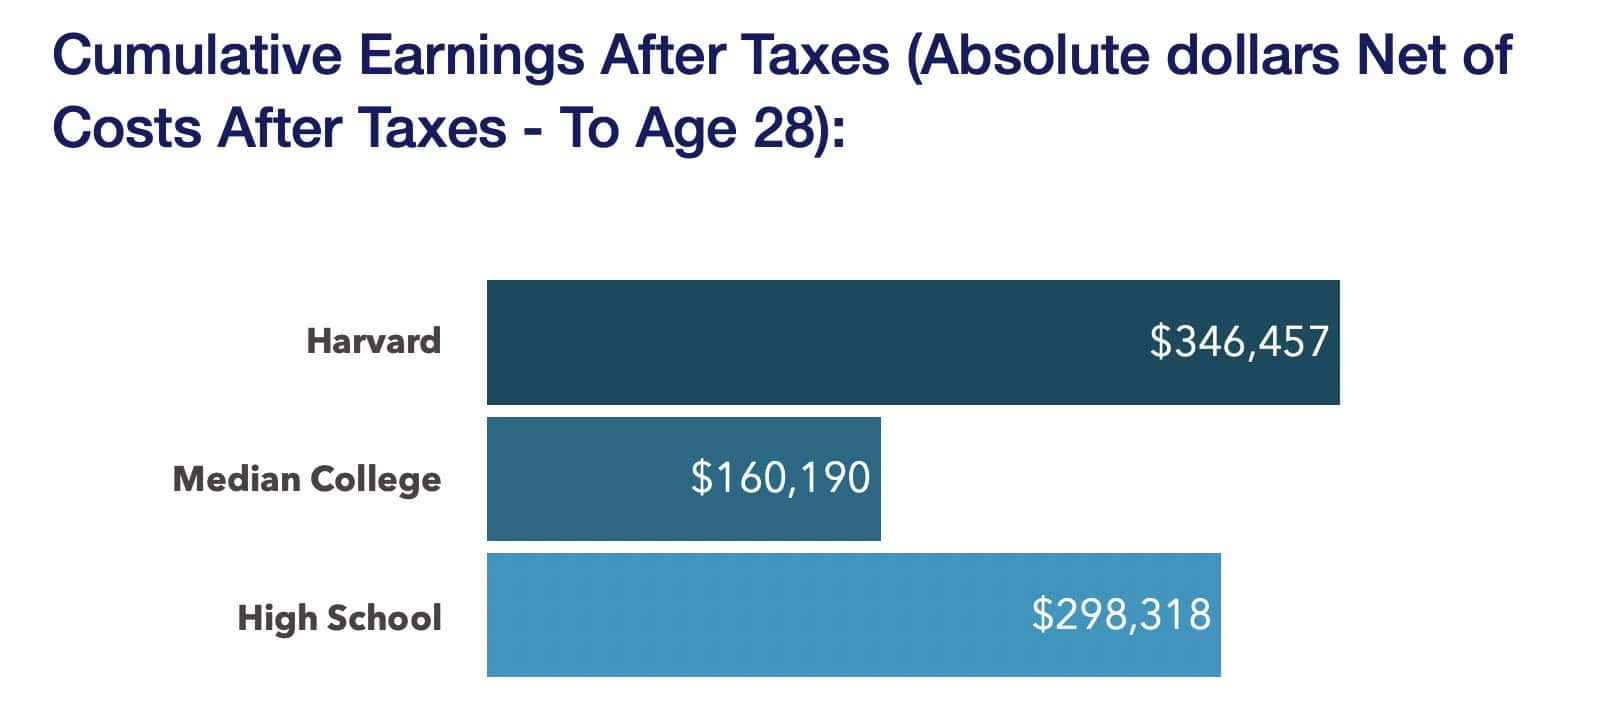
The median college graduate gap persists when we adjust for income taxes, and the Harvard graduate outperformance shrinks.
Finally, let’s put it all together and see the Harvard Graduate fall behind by $20k ($176k versus $199k) when we adjust for the time value of money by looking at the Net Present Value of the ten years of earnings after cost and taxes:
NPV Cumulative Earnings After Taxes (Net Present Value After Taxes and Costs – To Age 28):
Ten years after enrollment, even the median Harvard graduate with a median salary of $95,114, significantly over the Threshold 0 measure, is not on par with a high school graduate!
Now, let’s see what these look like for a lifetime, assuming retirement at 65.
Does Passing Threshold 0 provide a higher return over the college student’s lifetime?
First, look at the absolute earnings over the lifetime, net of college costs.
This is the comparison everyone uses, and it shows that the Harvard and Median High School graduates earn more than the median High Schooler after deducting college costs. Many researchers stop here because of the overall advantage of total income (the “College Wage Premium”).
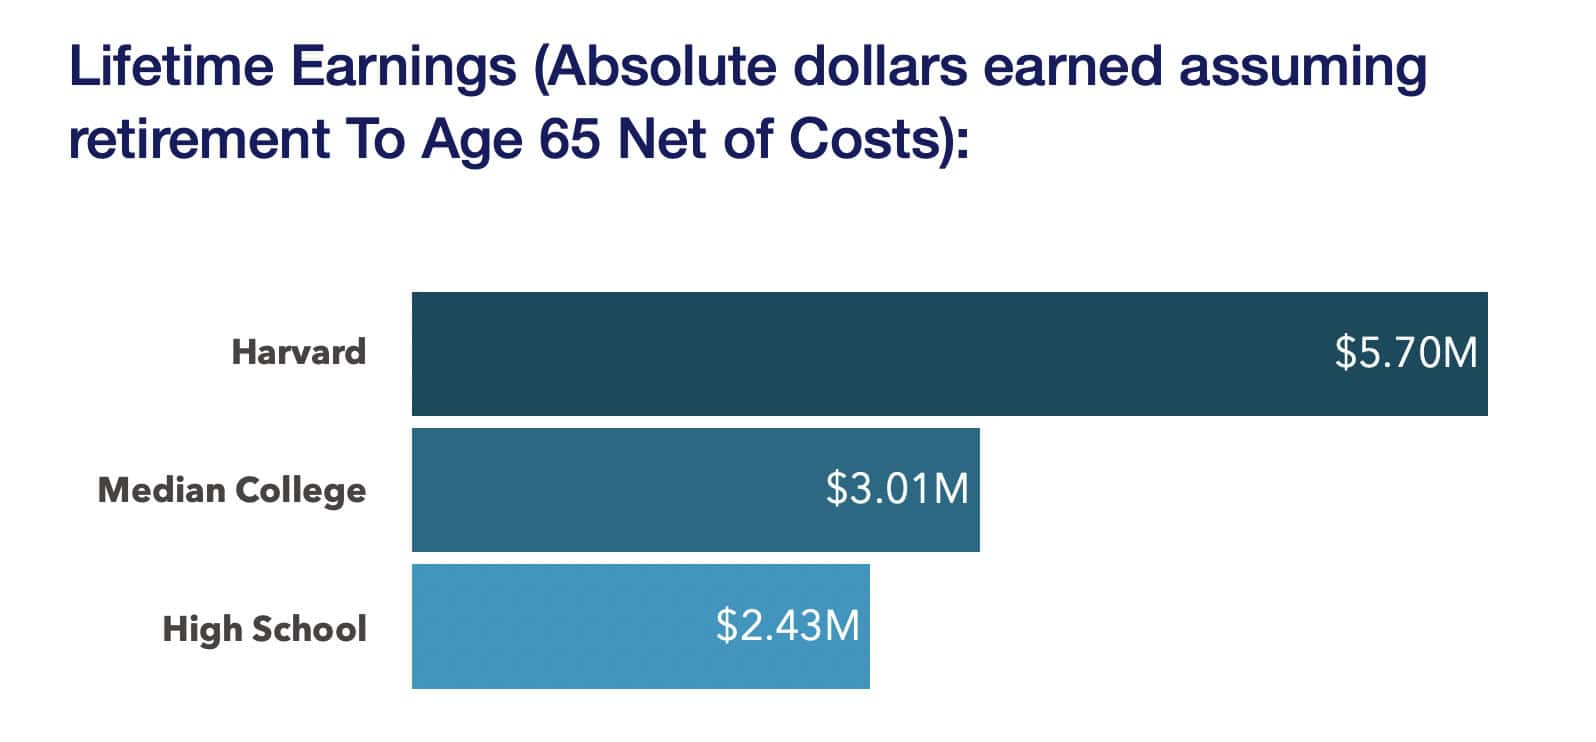
As we have argued, this does not tell the full economic return story. We still need to look at what happens after taxes and when adjusted for the time value of money. Next, let’s look at what happens when we adjust for taxes.
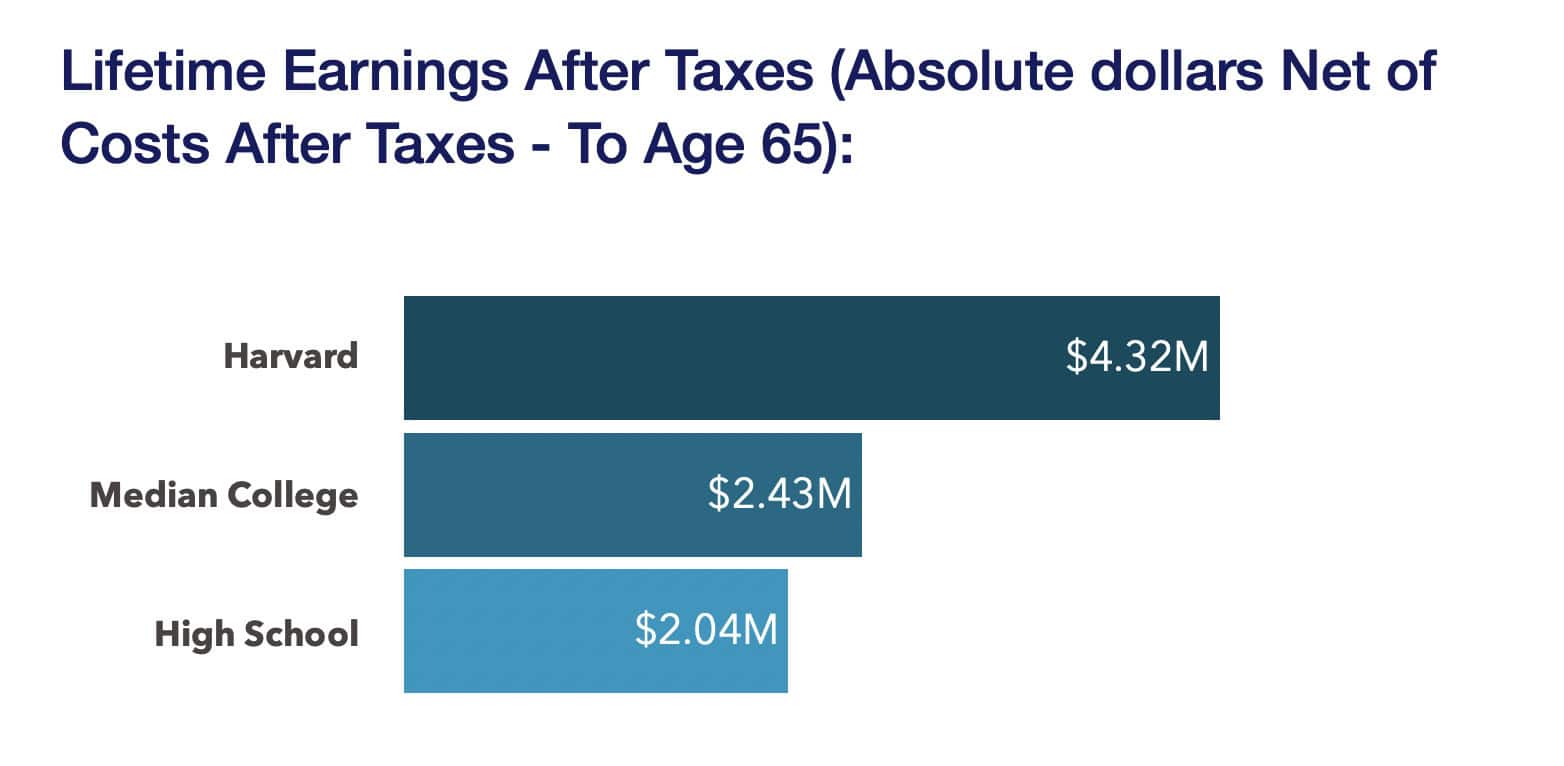
Even after Taxes, College graduates are still better. But let’s add it all up and see what happens when we adjust these results for time value.
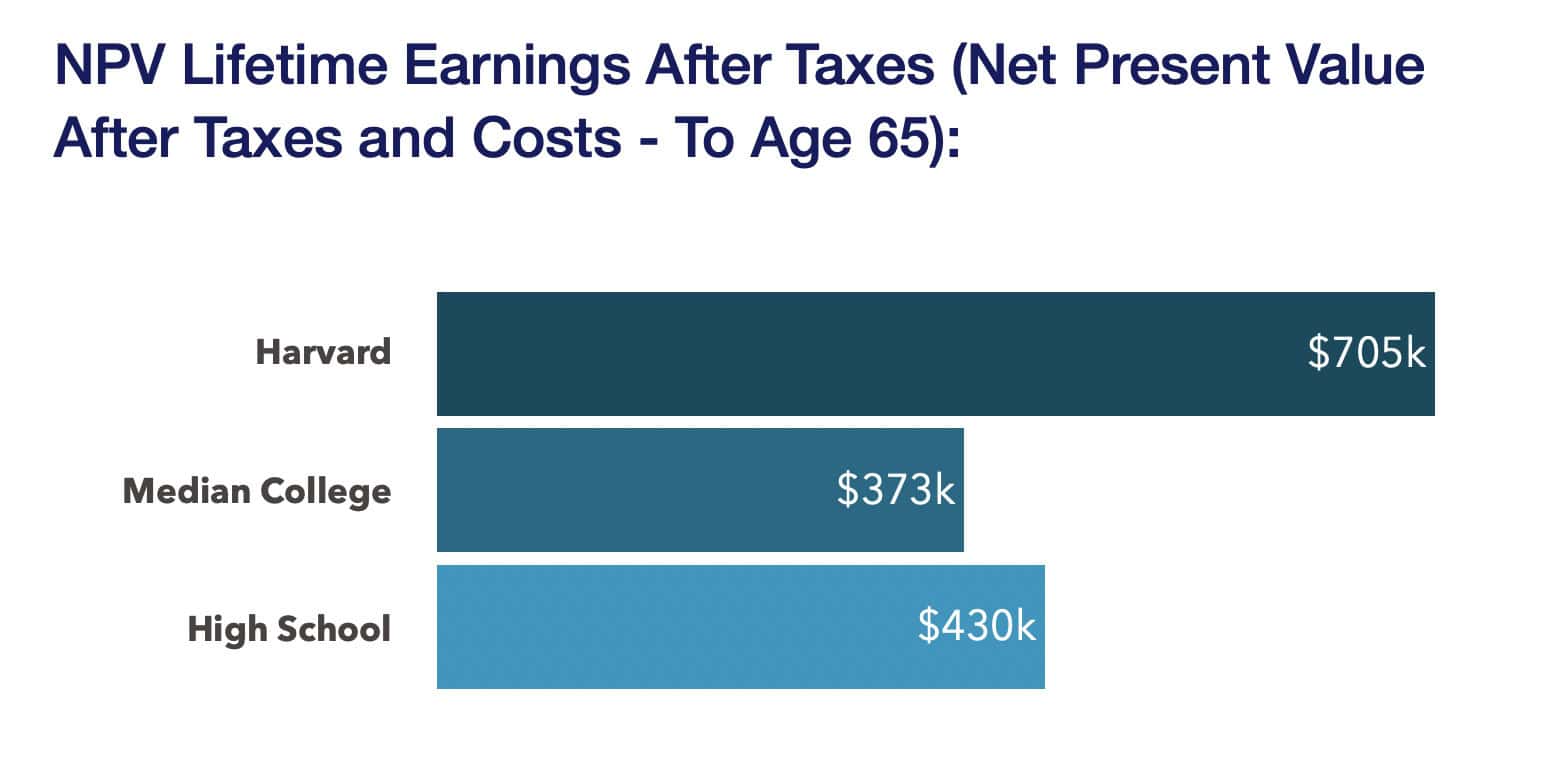
The Harvard Graduate is acceptable because of their significantly high earnings over Threshold 0. However, students earning the median college salary and paying the median net price to attend college generate a subpar return measured by the net present value of their lifetime earnings after taxes and costs compared to the median high school graduate!
Over the lifetime, the median College graduate with a median salary of $50,806, well above Threshold 0, generates a return well below that of a high school graduate!
The IHEP Threshold 0 are too low: They use lower state high school standards, flat costs, and ignore opportunity costs. Students earning Threshold 0 salaries ten years after enrollment will not generate a return above the high school graduate.
Conclusion
Threshold 0 is a pioneering effort to set some standards for college minimum returns. Still, its reliance on state-specific benchmarks and neglect of cost inflation, opportunity costs, taxes, and the time value of money overstate the economic return of higher education.
These omissions risk misleading students, policymakers, and institutions about a college’s worth, potentially leading to misinformed decisions on enrollment and funding.
Our analysis shows that even institutions meeting Threshold 0 may not provide a true economic advantage. The bar is too low.
IHEP should revise its metric to incorporate these factors and test whether its conclusion, that most colleges deliver a minimum return, holds up.
A more accurate measure, grounded in NPV of lifetime earnings after taxes and costs, would better ensure that higher education fulfills its promise of economic mobility.
Reference Sources
- Dancy, Kim, Genevieve Garcia-Kendrick, and Diane Cheng. “Rising Above The Threshold.” Ihep.Org. Institute For Higher Education Policy, June 1, 2023. https://www.ihep.org/wp-content/uploads/2023/06/IHEP_Rising-above-the-Threshold_rd4.pdf ↩︎
- Leschly, Stig, Yazmin Guzman, and Michael Itzkowitz. “Degree-Specific Earnings Outcomes of Graduates From Colleges in Massachusetts.” Postsecondarycommission.Org. Post Secondary Commission, December 1, 2021. https://postsecondarycommission.org/wp-content/uploads/2022/09/Degree-Specific-Earnings-Outcomes-of-Graduates-From-Colleges-in-Massachusetts-3.pdf. ↩︎