The prevailing wisdom is that college is good for you.
It’s so good that even if you drop out, you will be better off.
That’s what they say.
How does this play out in the real world?
Perhaps the title of this piece gives you a little clue about our view of the landscape. Read on to find out why we warn against some degrees.
“Risk comes from not knowing what you are doing.”
Warren Buffet
College is risky
When researching the material for our model, we were struck by how often college was framed as a low-risk path to better outcomes.
They say college is good for you, even if you don’t graduate. Wouldn’t you want to go out and get a college degree, no questions asked?
The government might pay for some of it. Or you could get government-subsidized loans. Some may have scholarships and grants to get that college degree at a discount from what others are paying. How risky can a college degree be?
Our examination of the data shows this is far from the reality.
Getting a college degree to deliver value is far from risk-free. It is fraught with risk, from choosing the right field of study to getting into the right school, graduating from that school, and getting a good job.
Let’s show you.
Field of Study Risk
The U.S. Department of Education’s National Center for Education Statistics creates and maintains Classification of Instruction Program (CIP) Codes. These represent a taxonomy or classification system whereby educational programs and their outcomes can be grouped and tracked. The codes are revised every 10 years, with the most recent release in 2020.
CIP codes come in three levels of detail: two digits, four, and six. The six-digit code is the most detailed, and the others represent levels of summarization. For example, 11.0103 is Information Technology, which is included in 11.01 Computer and Information Sciences, General, and that is included in 11, which represents Computer and Information Sciences and Support Services.
It’s a good way for fields of study to be mapped, organized, and tracked. All data is collected at the lowest level and then aggregated upwards.
In the 2020 version, there are 2028 detailed CIP Codes, representing tracked fields of study. 1,568 of these codes were carried over from 2010, and 460 new codes (29%) were added.
The changes to CIP codes are necessary to reflect new areas of emerging study and as others become less relevant. But the large number of classifications illustrates the challenge in navigating fields of study.
The DOE collects data at the lowest level for each institution that offers them. It makes that data publicly available after some time has elapsed. However, if there are not enough students in a field of study in a particular institution, then that data may be hidden due to privacy concerns. The result is that data is not publicly available for many fields of study at the institution level.
When evaluating Fields of Study, we found a small representation of 4-year degree data we were looking for – only 23,087 programs covering 2 million students. That’s less than a third of programs and a quarter of Bachelor students.
Given the dearth of information, how do students effectively navigate choosing a field of study? Do they assume their chosen field of study will result in a valuable degree just because they are good at the material or because they like the material?
In 2021-22, postsecondary institutions handed out 2 million bachelor’s degrees. Nearly one in 16 were Psychology Graduates (at 129,600 or 6.5%), 80% of whom were women. It was the fifth largest category.(2)
The CIP Code for Psychology is 42, and Psychology , General has a detailed code of 42.0101, for example.
The Department of Education (DOE) shows that in 2018, the Median annual earnings of 25- to 29-year-old bachelor’s degree holders were $50,600.
Psychology? $41,400.(3)
Another U.S. Government Department, the Department of Labor, has a Bureau of Labor Statistics (BLS) that tracks employment and other labor statistics. The BLS has its own classifications, like the CIP, but if you search, you will find comparable categories.
In the BLS classification, Psychologists are 19-3030, and there are 196 thousand Psychologists employed in 2022. Of those, only 17 thousand hold a bachelor’s degree.(4)
It projects there will be 208 thousand psychologist jobs by 2032. The number will grow by 12 thousand in ten years, yet we graduated 129 thousand in 2021 alone.
The BLS shows 12.8 thousand openings a year, but most of those are job changes or churn, not new ones.
The Psychologist group consists of four categories, detailed below.

Far too many students are studying psychology in relation to the jobs available and projected.
Worse, only a small number of those jobs are available to Bachelor’s degree holders!
Let’s look at another example, Cosmetology.
There are 1703 institutions (with data) in the DOE database offering Cosmetology undergraduate certificates. These are typically 10-month programs.
The DOE groups students into debt cohorts and shows 94,629 students received some government awards in the first year. Some 106,700 students received awards in the second year.
Over at the BLS, cosmetology is included in the Personal Appearance Worker category, specifically in subset 39-5012, which is related to hairdressers, hairstylists, and cosmetologists. The BLS says there are 555.8k employed in these fields in 2022 and 598.6k by 2032, an increase of 42.8k. Forty-six percent of these workers are self-employed. They also list the median salary for this group at $34,970, which includes all hairdressers, stylists, and cosmetologists of all ages and experience.
Take a look at the summary included in the DOE response for the creation of a new rule setting accountability thresholds. We have highlighted the Cosmetology line, which shows the Average income of students before ($27K) and after ($18K) the program, as well as the low threshold they want to introduce.
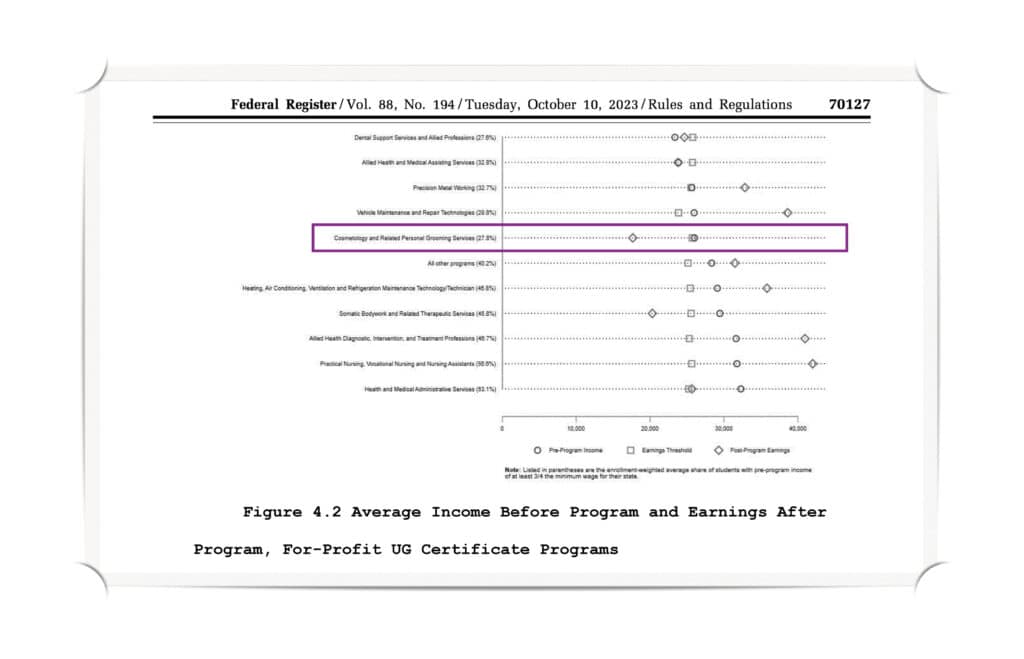
Like Psychology, cosmetology students are entering programs in such large numbers despite the limited demand for these roles. In cosmetology, they are making even less than they did before they started.
Do students entering these programs understand the risks?
Getting into the right college
If you consider going to Harvard and filling in the application, there’s a 97% chance you will not get in.
In fall 2022, the number of applications for admission from first-time, degree/certificate-seeking undergraduate students received by postsecondary institutions was 13,100,210. (5)
41.4% of those applications were not accepted, and only 58.6% were accepted. (6) And only 21% of those admitted ended up enrolling. (7)
Many choices are available to prospective students, but there is a high risk of not getting into the most desired option.
As we have shown before, there are few mechanisms that help parents and students select colleges with an understanding of their value.
Wealthy parents and their children may be inclined to use prestige, and some may want to continue with the parents’ legacy. Others use worthless college rankings. Some even elect their favorite college sports team.
How likely is it that the school with a winning football team will result in your best value for your chosen field of study?
It’s no surprise that there is a significant risk related to college selection for parents and their students. The outcomes are evident in graduation rates!
Graduating
The DOE measures and publishes graduation rates at 150% of the normal completion time. So, for four-year degrees, that standard is what proportion has graduated six years after enrollment. We have previously detailed the challenge with standards related to how graduation rates are measured, but let’s explore the performance with easier standards.
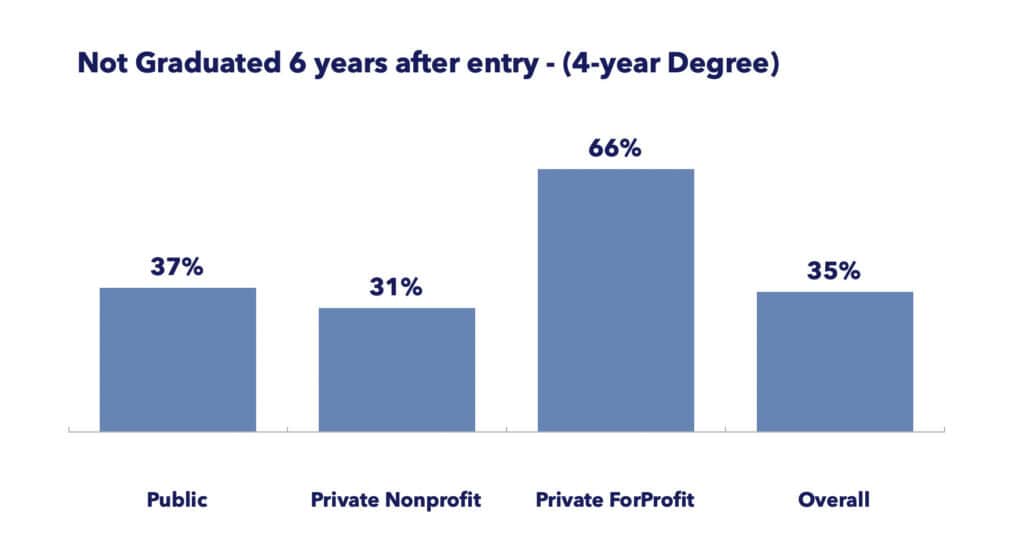
The above, which examines the 2016 cohort of students, clearly shows that students wanting to attend a Bachelor’s program have a significantly higher risk when attending a Private for-profit institution than other types. Fortunately, this is a smaller proportion of institutions.(8) Yet a 31-37% failure rate six years after enrollment for a four-year degree is not low risk either.
We can examine the graduation rates by college selectivity for the same cohort, and find the following:
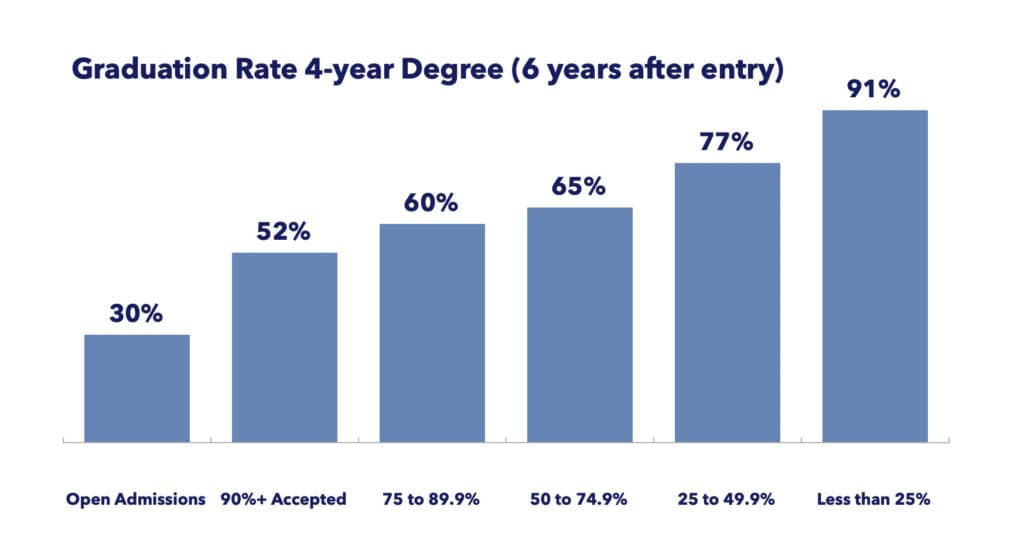
Clearly, if the college is more selective, there is a lower risk for the students’ ability to graduate in six years. However, as we saw earlier, there is a significantly higher risk of getting into those schools.
It’s even worse at the Associate/Certificate level in 2-year institutions.
These programs are shorter, so we have more recent data. In this case, the 2019 cohort of students. (9)
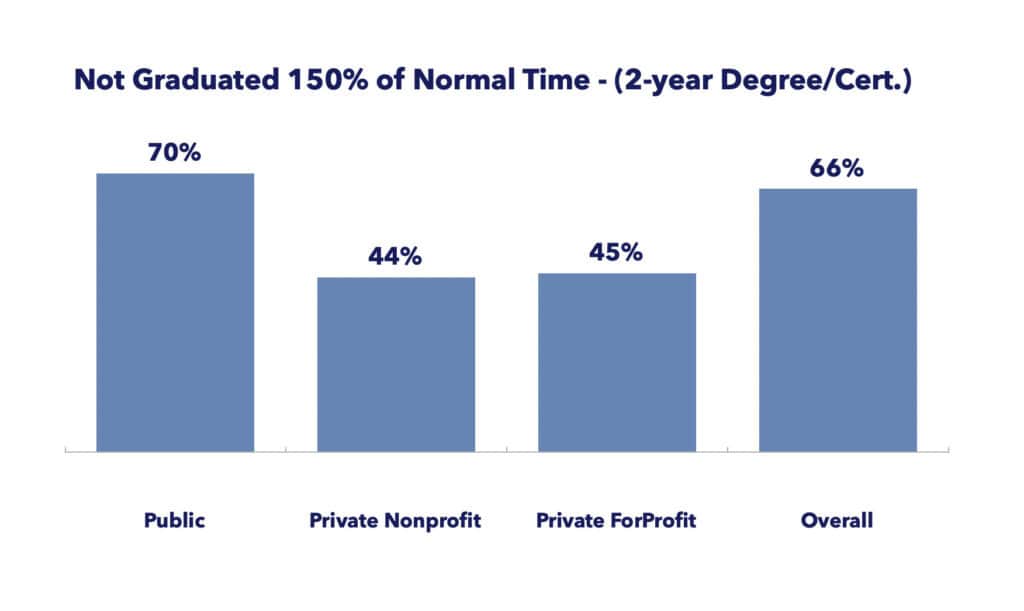
From the chart shown, it’s clear that students who want to attend an associate/certificate program have a significantly higher risk when attending a public institution.
How does anyone consider this performance low risk?
Getting a good job
If a student has successfully navigated the risks of choosing the right field of study, getting into the right school, and graduating, one might assume they are in a good position to earn a substantial reward. However, the risks do not end upon graduating from college.
The problem here is a risk called underemployment. A risk that many ignore or assume does not exist.
Why do we have such difficulty with the concept? Let me illustrate with a thought experiment. We were chatting at a party when I saw my old friend Alex approaching us. I turn to you and tell you that Alex has a bachelor’s degree. I ask you to guess what Alex does for a living. Is Alex a retail salesperson or a Personal Financial Advisor?
Think about it for a minute.
If you guessed retail salesperson, you would be correct. There are four times as many retail salespeople with a Bachelor’s degree (821k) as there are personal financial advisors (328k, of which 175k are bachelor’s holders).
Welcome to the hidden underemployment problem. We don’t see it in our everyday lives. Our Barista never declares they have a master’s degree, and your waiter never discloses their doctorate degree. We assume that the people in high-paying jobs have college degrees, and the people in lower-paying jobs have no degrees.
Most of us are familiar with Visible Underemployment. That occurs when individuals work fewer hours than they would prefer or need, often taking on multiple part-time jobs to make ends meet. For example, a person qualified for a full-time role but can only find part-time work falls. They are not unemployed, but they are not fully employed either.
Hidden Underemployment, though, refers to when individuals are employed in jobs that do not match their skill set or education level. For instance, a graduate working in a job that does not require a degree, such as a waiter or a delivery driver, despite having a degree.
The Federal Reserve measures hidden underemployment. The underemployment rate is the share of graduates working in jobs that typically do not require a college degree.
A job is classified as a college job if 50 percent or more of the people working in that job indicate that at least a bachelor’s degree is necessary; otherwise, the job is classified as a non-college job. (10)
How significant is the underemployment risk for graduates?
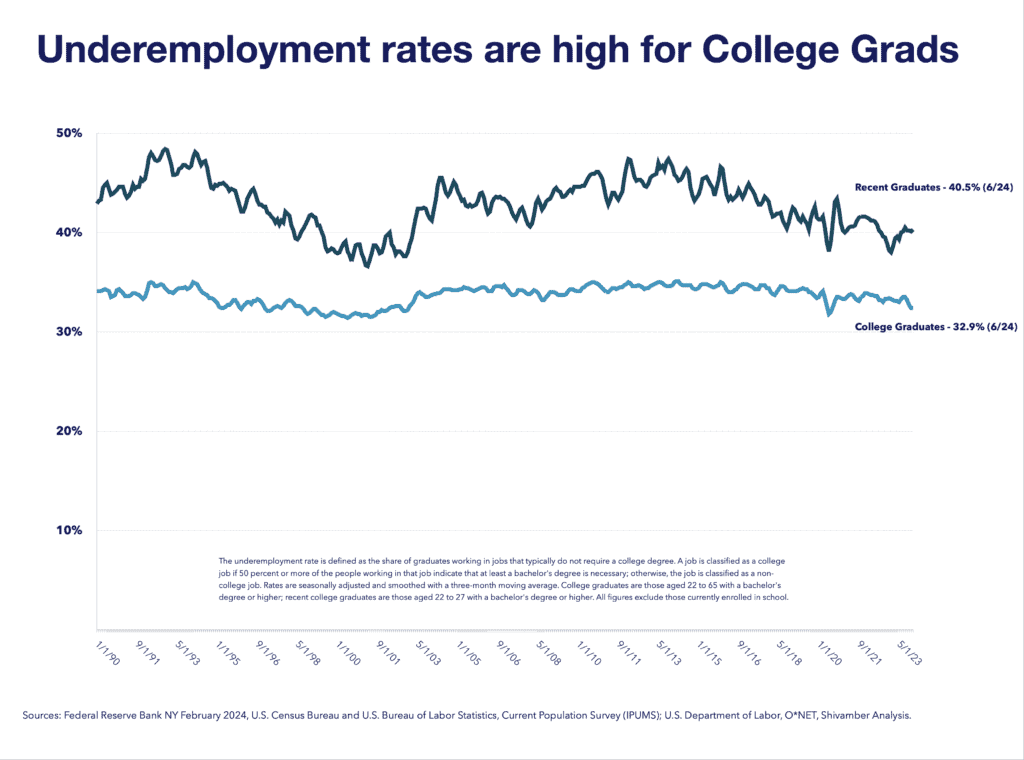
The Federal Reserve shows that 40.5% of recent graduates (22 to 27 years old) are underemployed, and 32.9% of all college graduates (22 to 65 years old) are underemployed. These rates include all Bachelor’s, Master’s, Doctorate, and Professional Degrees.
Burning Glass Institute and Strada Education Foundation published their Talent Disrupted report examining the state of underemployment in February 2024. They say: “Among workers who have earned a bachelor’s degree, only about half secure employment in a college-level job within a year of graduation, and the other half are underemployed—that is, working in jobs that do not require a degree or make meaningful use of college-level skills. Some graduates who are initially underemployed eventually secure a college-level job, but the majority remain underemployed 10 years after graduation.”(11)
A study first published in 2014 says: “college graduates who became underemployed after graduation receive about 15-30 percent fewer interview requests than job seekers who became “adequately” employed after graduation.”(12)
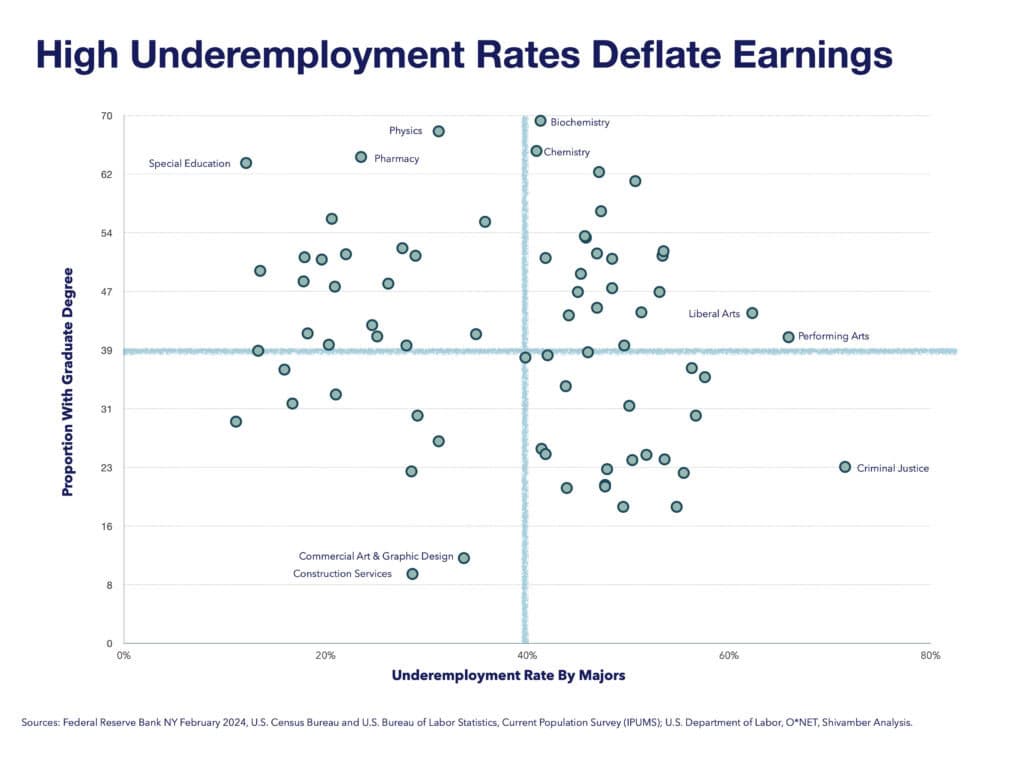
Fields of study with weak supply demand characteristics will have high under-employment and depressed earnings. Psychology, with 51% holding advanced degrees, has a 48% underemployment rate.
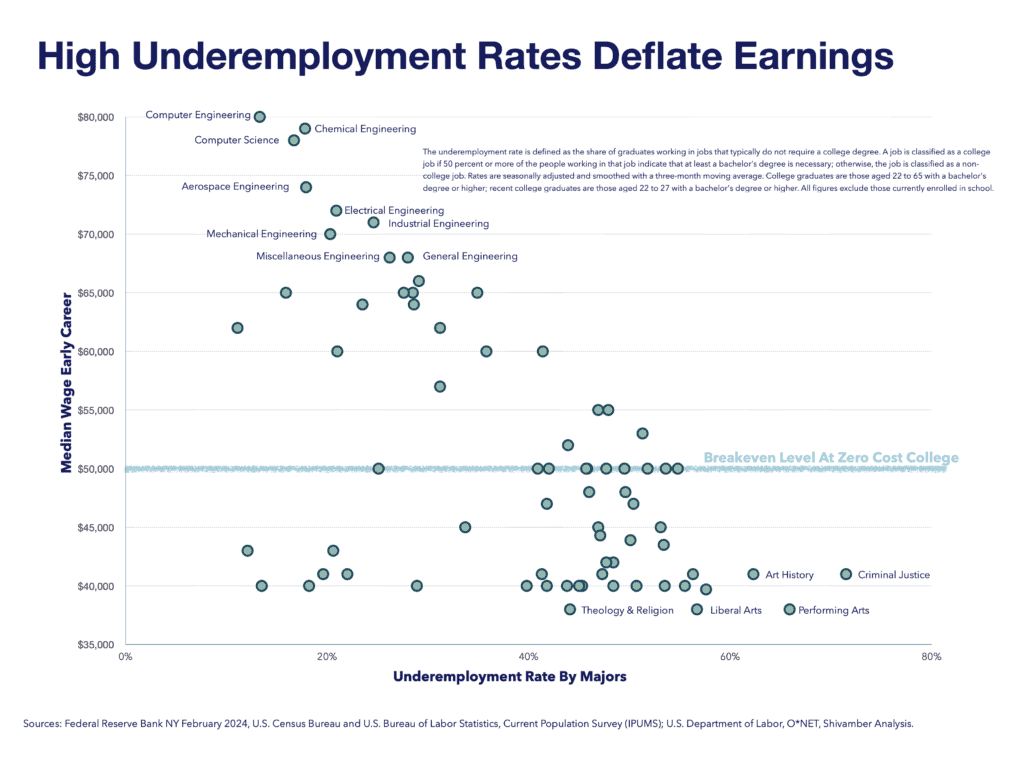
Hot fields such as engineering and computer science have relatively low underemployment rates, translating into high median salaries of over $65k.
In contrast, high-underemployment fields such as Liberal Arts, Performing Arts, Art history, and Criminal Justice, all with more than 50% underemployment, generate subpar median earnings just slightly over $40k.
College is Low Risk?
The ecosystem supports a drive to increase college participation. It’s viewed as a path to a better society, wealthier and less unequal.
Analysis showing inequalities often highlight the higher presence of college degrees among the wealthier. The conclusion is that getting more college degrees for lower-income groups would reduce inequality.
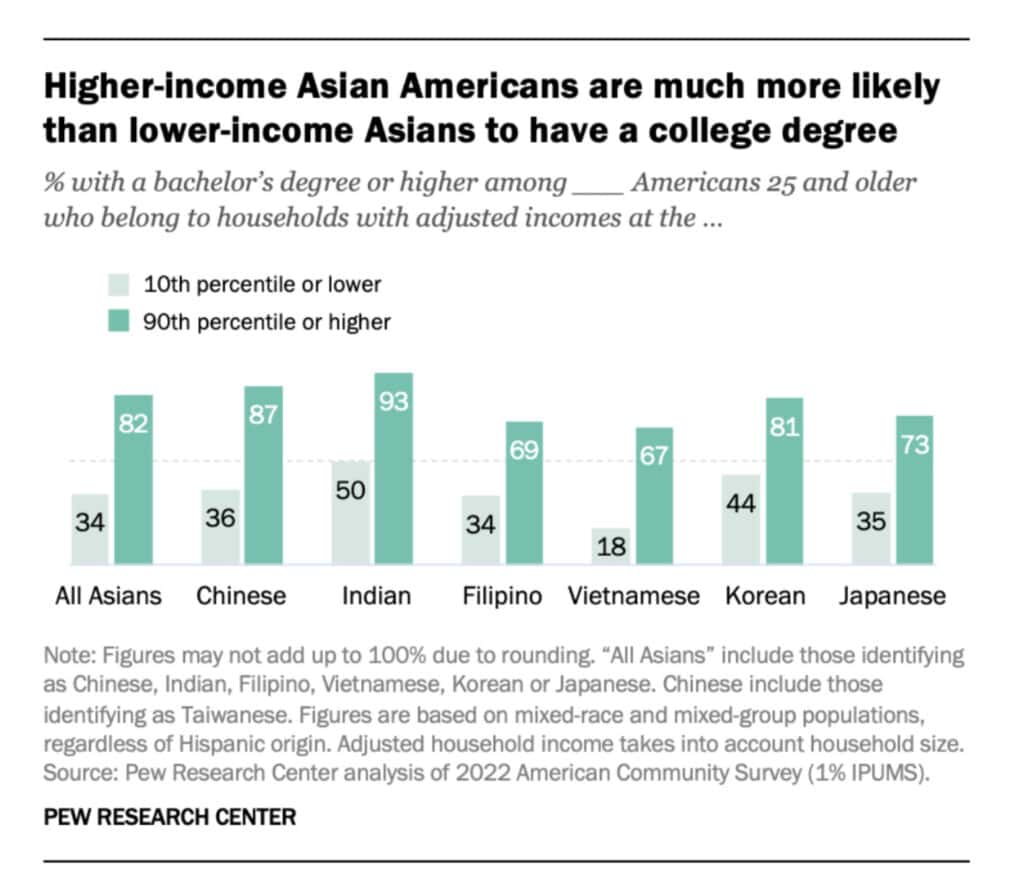
One example of income inequality among Asians is shown here from a recent Pew Research study. (13) It shows the percent of college degree holders in the lowest and highest 10 percentile of incomes.
Naturally, there is a much higher prevalence of college degrees among top income earners (82% overall, with 93% among Indians).
But if college degrees are the low-risk answer, one has to explain why so many college degree holders are also in the lowest group of income earners.
If college degrees are low risk, one should not see 50% of Indians or 44% if Koreans with degrees among the lowest income group.
We have previously covered the economic challenges of college value, so we won’t repeat it here.
Perhaps those who recommend College Degrees should consider a warning label. College will be great for you, if you pick the right field of study, get into the right college, graduate, and escape the underemployment problem.
Reference Sources
- “The Classification of Instructional Programs.” Nces.Ed.Gov. U.S. Department of Education National Center for Education Statistics, Accessed July 29, 2024. https://nces.ed.gov/ipeds/cipcode/resources.aspx?y=56.
- National Center for Education Statistics. (2024). Undergraduate Degree Fields. Condition of Education. U.S. Department of Education, Institute of Education Sciences. Accessed July 29, 2024 from https://nces.ed.gov/programs/coe/indicator/cta.
- National Center for Education Statistics. (2022). Employment Outcomes of Bachelor’s Degree Holders. Condition of Education. U.S. Department of Education, Institute of Education Sciences. Accessed July 29, 2024 from https://nces.ed.gov/programs/coe/indicator/sbc.
- U.S. Department of Labor Bureau of Labor Statistics. “Occupational Projections and Worker Characteristics.” Bls.Gov. Accessed July 29, 2024. https://www.bls.gov/emp/tables/occupational-projections-and-characteristics.htm#BLStable_2024_4_11_10_42_footnotes.
- U.S. Department of Education National Center for Education Statistics. ”Trend Generator: Admissions.” Nces.Ed.Gov. Accessed July 29, 2024. https://nces.ed.gov/ipeds/TrendGenerator/app/answer/10/101.
- U.S. Department of Education National Center for Education Statistics. ”Trend Generator: Admissions.” Nces.Ed.Gov. Accessed July 29, 2024. https://nces.ed.gov/ipeds/TrendGenerator/app/answer/10/102.
- U.S. Department of Education National Center for Education Statistics. ”Trend Generator: Admissions.” Nces.Ed.Gov. Accessed July 29, 2024. https://nces.ed.gov/ipeds/TrendGenerator/app/answer/10/103.
- U.S. Department of Education National Center for Education Statistics. ”Graduation Rate from First Institution Attended for First-time, Full-time Bachelor’s Degree-seeking Students.” Nces.Ed.Gov. Accessed July 29, 2024. https://nces.ed.gov/programs/digest/d23/tables/dt23_326.10.asp.
- U.S. Department of Education National Center for Education Statistics. ”Graduation Rate from First Institution Attended within 150 Percent of Normal Time for First-time, Full-time Degree/Certificate-seeking Students.” Nces.Ed.Gov. Accessed July 29, 2024. https://nces.ed.gov/programs/digest/d23/tables/dt23_326.20.asp.
- Federal Reserve Bank of New York. ”The Labor Market for Recent College Graduates.” Newyorkfed.Org. Accessed July 29, 2024. https://www.newyorkfed.org/research/college-labor-market#–:explore:underemployment.
- Burning Glass Institute and Strada Institute for the Future of Work, Talent Disrupted: Underemployment, College Graduates, and the Way Forward, 2024. Accessed July 29, 2024. https://stradaeducation.org/wp-content/uploads/2024/03/Talent-Disrupted-2.pdf.
- Nunley, J. M., Pugh, A., Romero, N., & Seals, R. A. (2017). The Effects of Unemployment and Underemployment on Employment Opportunities: Results from a Correspondence Audit of the Labor Market for College Graduates. ILR Review, 70(3), 642-669. https://doi.org/10.1177/0019793916654686
- Budiman, Abby. “Income Inequality Is Greater among Chinese Americans than Any Other Asian Origin Group in the U.S.” Pewresearch.Org. Pew Research Center, May 31, 2024. https://www.pewresearch.org/short-reads/2024/05/31/income-inequality-is-greater-among-chinese-americans-than-any-other-asian-origin-group-in-the-us/.