We have a significant level of political polarization in this country. This is mainly due to contradictory interpretations or opinions, usually ideological, of important policy decisions.
Much of what we feel about policy choices is shaped by what others tell us about the likely impact of those decisions. Sadly, many will choose unwisely against their own interests due to financial illiteracy, misinformation, or both.
We face an epidemic of both challenges.
Let me explain with a current example..
“Whoever is careless with the truth in small matters cannot be trusted with important matters.”
Albert Einstein
- The math adds up in aggregate
- The interpretation of the math does not
- Where Lower Income Families Spend Their Money
- The Real Numbers for Lower Income Families
- The Misinformation Machine
- The Substitution Effect They’re Missing
- What the Bottom 50% Faces
- The Political Reality
- Beyond the Soundbites
- Reference Sources
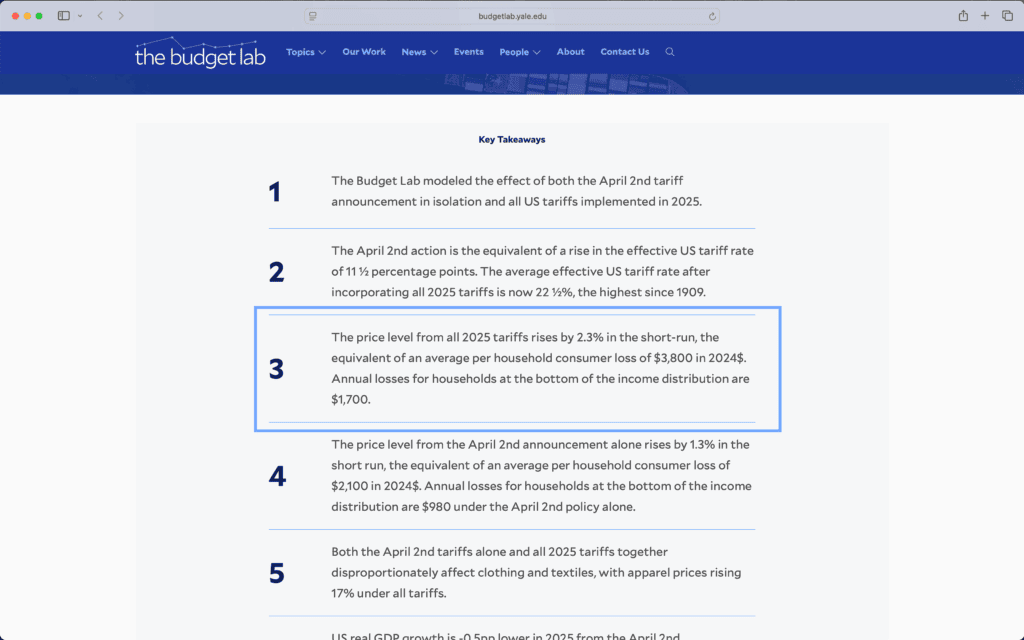
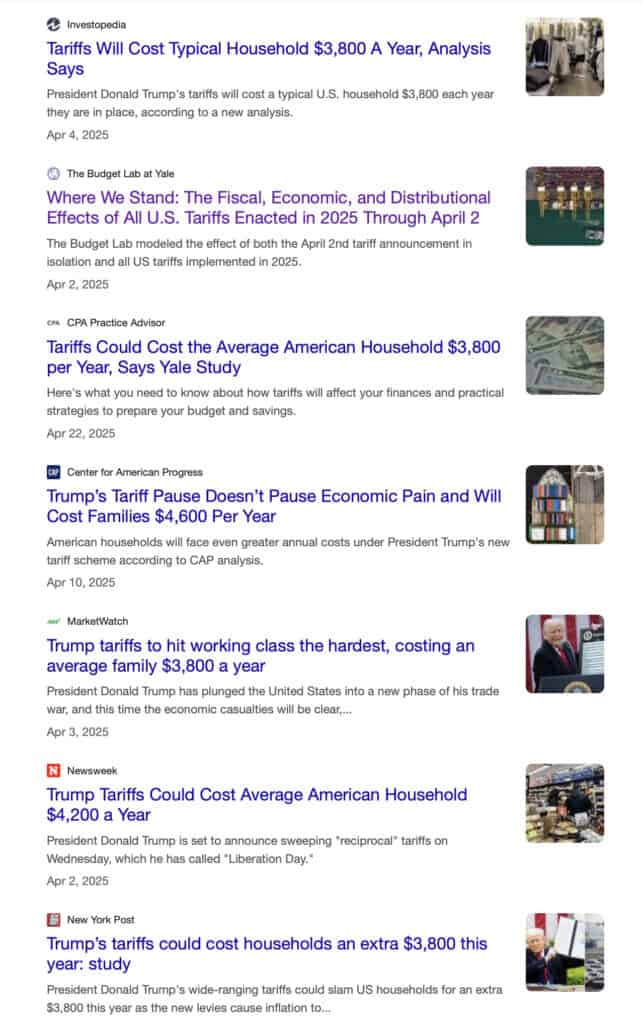
You have probably seen the headlines proclaiming that the average American should expect a $3,800 negative impact due to tariffs. The researchers and those writing these stories explain that the government projects a $600B tariff collection, and the average American household should expect to pay $3,800 more for goods they bought previously (without the tariffs).
I know a little about tariffs, having spent many years on international trade and written on the topic before here: Are Tariffs A Trade Fix or Economic Chaos? and The iPhone Tariff problem, why its time for a smarter approach. So, I was intrigued by this finding that contradicted my own analysis.
A little exploration, and here is what I found.
The math adds up in aggregate
With 153.8 million taxpayers (as of 2022), the $3,800 makes sense ($600B divided by 153.8M taxpayers), but what it is represented as meaning is questionable. [1]
There is a massive difference between “an average of $3,800 per American” and “$3,800 per average American.”
The calculation means the former, but it is pitched as the latter.
The reality is stark but simple: tariffs will average $3,800 per American household, but the average American household won’t pay $3,800. The bottom half of earners — those making under $50,000 — will face dramatically lower costs while wealthy households bear the brunt.
This isn’t statistical semantics. It’s a meaningful difference in interpreting facts. That interpretation is incredibly useful if we want to understand who gets affected and by how much when trade wars escalate.
The interpretation of the math does not

The Yale Budget Lab’s headline-grabbing figure comes from a straightforward division: total tariff revenue divided by total households. That $3,800 is the average tariff impact per American taxpayer (assuming the tariff receipts are $600B).

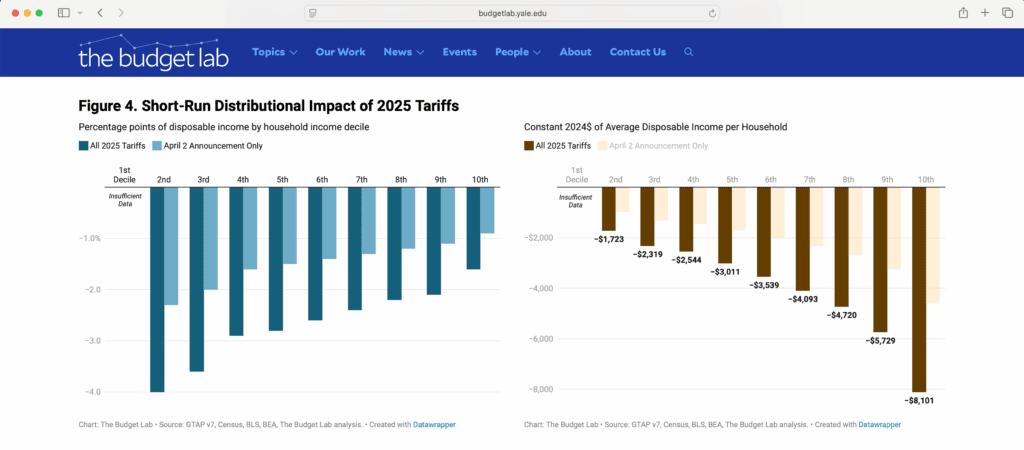
To be fair, Yale Budget Labs acknowledges the $3,800 as an average and includes a distributional analysis that shows what they think would happen with different household income levels.
News organizations ran with the overall headline and interpreted the study as a $3,800 impact on the average household.

But this calculation treats a family earning $30,000 the same as one earning $300,000. It assumes identical spending patterns, consumption choices, and exposure to imported goods across all income levels.
That analysis does not reflect the impact on the average American.
The bottom 50% of American households — those earning less than $50,339 — face a completely different economic reality.
After taxes, these families take home roughly $48,500 annually. That’s right, they contribute about 3% of taxes collected, and I have written about ways to reduce their burden here: This small move transforms Federal income Taxes to help millions.
The bottom 50% spend their money very differently from wealthy households. And crucially, they face far less exposure to the imported goods that tariffs target.
Where Lower Income Families Spend Their Money
Exploring the spending patterns of lower-income households reveals the buffer from tariffs.
Low-income households allocate 41% of their budgets to housing, rent, utilities, and mortgage payments. These are predominantly domestic services with minimal tariff exposure.[2]
Another 16% goes to food; about 90% of consumption comes from domestic sources. While some imported ingredients face tariffs, the bulk of what poor families eat, that is, bread, milk, and basic proteins, comes from American farms and processors.[2,3]
When you map spending patterns against import exposure, a clear picture emerges:
- Housing: 5% import exposure
- Food: 13% import exposure
- Transportation: 25% import exposure
- Healthcare: 8% import exposure
- Other goods: 35% import exposure
For low-income households, only about 15.4% of total spending faces significant tariff exposure. Wealthy families, by contrast, spend 38% of their budgets on discretionary items with high import content.[2]
The Real Numbers for Lower Income Families
Consider a typical household earning $50,339 at the top of the lower-income 50%. After taxes, they take home $48,500. They consume about $45,700 annually.
Only $7,000 of that spending goes toward goods with meaningful tariff exposure.
With current tariff rates averaging around 15%, this family faces price increases of roughly $1,050 per year. This is significantly less than the Yale estimate for the bottom quintile ($1,723) and below one-third of their overall average ($3,800).
Let me say that again. A reasonable estimate of tariff impact to the median household at the top of the low-income 50% bracket is $1,050. That is even lower than Yale Labs’ estimated $1,723 for their bottom quintile.
Even if effective tariff rates climb to 35% — accounting for the highest levies on specific products — this household would pay roughly $2,400. That matches Yale’s “average” figure, but only under extreme assumptions about tariff rates.
The math is unforgiving for higher-income households. A family spending heavily on electronics, luxury goods, and imported services faces much greater exposure. They have the income to absorb it and bear the burden.
The Misinformation Machine
How basic information gets analyzed and reported in the media deserves scrutiny.
In this case, the Yale Budget Lab delivers a seemingly innocuous top-line average per American household but botches the distribution analysis details. Media partners pick up the headline average and turn it into a distressing story about the impact on the average American household.
The Yale Budget Lab deserves scrutiny beyond its methodology. I will explore this further in a later piece.
For now, the “non-partisan” authoritative research bears more scrutiny before reporting on its findings.
The Budget Lab’s leadership comes directly from ideological backgrounds and experience with opposing administrations, with no comparable representation from alternative policy circles.[4]
This isn’t about partisan conspiracy theories. It’s about acknowledging that research institutions reflect their environments. When every senior researcher spent years crafting arguments against one administration’s trade policies, their “nonpartisan” analysis carries predictable bias.
The Lab’s framing consistently emphasizes costs while minimizing benefits. It treats tariff revenue as deadweight loss rather than examining how it might offset other taxes. It assumes no substitution for domestic alternatives, no job creation in protected industries, and no strategic value from reducing dependence on foreign supply chains.
Data misinterpretation is understandable. Deliberate misinterpretation is misinformation.
When a research organization makes no effort to correct how it and its research are characterized, that looks like misinformation.
The Substitution Effect They’re Missing
Lower-income families are substitution champions. When prices rise, they switch to cheaper alternatives faster and more completely than wealthy households.
If Chinese electronics get expensive, affluent families grumble and pay up. Poor families buy used phones, shop at different stores, or delay purchases entirely. They have more substantial incentives and more flexibility to avoid tariff-hit products.
The Yale analysis acknowledges this substitution effect could reduce their estimates by 15-20%, but they bury this crucial caveat. Substitution effects could cut tariff impacts in half for households with limited budgets and strong price sensitivity.[5]
What the Bottom 50% Faces
Based on realistic assumptions about spending patterns, import exposure, and substitution behavior, the bottom 50% of American households likely face tariff burdens between $500 and $1,500 annually, not the $2,400-$3,800 suggested by crude averages.
This represents 1-3% of their after-tax income, compared to the 3.4% figure the Yale study claims for the bottom quintile. The difference matters enormously for families living paycheck to paycheck.[5]
It also matters greatly if you are out there complaining about the impact of tariffs based on misinformation.
Meanwhile, the top 20% of households earning over $149,100 face the bulk of tariff costs. They spend heavily on imported goods, will not substitute, and consume more specific products with the highest tariff rates.
The Political Reality
This distributional analysis explains the political durability of tariffs. The voters most likely to support trade protection face the lowest costs. Working-class families see potential job benefits while experiencing minimal price increases.
You would never understand that from the way this is being reported.
Upper-income households, those most opposed to tariffs, bear the financial burden. They have the resources to absorb higher costs but lack the political numbers to prevent the policies.
The $3,800 average becomes a misleading weapon in political debates. It suggests working families will face crushing burdens, when the reality is far more nuanced.
Beyond the Soundbites
Trade policy deserves better analysis than mathematical averages that obscure more than they reveal.
The Yale Budget Lab’s headline figures drive political narratives but fail to capture the complex ways different households experience these policies properly.
The bottom 50% of American households won’t pay $3,800 in tariff costs. That is, unless we collect $2.5 trillion in Tariffs. They’ll pay substantially less while potentially benefiting from job creation in protected industries. The wealthy will pay significantly more while having the income to handle it.
That’s not a vindication of tariff policy. But it’s the truth about who pays the bills when America chooses trade protection over free trade.
The honest debate should focus on whether modest costs for working families and higher costs for the wealthy produce sufficient benefits in jobs, national security, and economic independence.
That’s a more complicated conversation than scary averages. But it’s the one we need to have.
Reference Sources
- https://taxfoundation.org/data/all/federal/latest-federal-income-tax-data-2025/
- https://www.statista.com/statistics/247420/percentage-of-annual-us-consumer-spending-by-income-quintiles/
- http://www.ers.usda.gov/data-products/charts-of-note/chart-detail?chartId=88950
- https://yaledailynews.com/blog/2020/11/30/yale-alums-named-to-prominent-positions-in-biden-administration/
- https://budgetlab.yale.edu/research/state-us-tariffs-august-1-2025