With the increasing focus on the return on investment of colleges among Americans, the need for a solution is more pressing than ever. Consequently, every pundit has stepped up to the plate, offering a range of college ROI ranking methodologies.
The misuse of various metrics underscores the crucial need for a deeper comprehension of financial metrics and their correct application.
This improvement will enhance financial literacy and empower parents and students to make more informed and beneficial college choices.
In this article, I will explain, using simple real-world examples, why many metrics will not help parents or students make better college choices.
Finally, I will equip you with the best approach to comprehend a college’s ROI —one that will inform your decision-making process and prepare you to determine whether your investment in college will deliver a good return, considering the net present value after costs and taxes.
Read on to find out more.
“The number one problem in today’s generation and economy is the lack of financial literacy.”
Alan Greenspan
The College Wage Premium
The college wage premium, often used by pundits to assess college ROI, indicates the proportion of additional earnings a college graduate can expect compared to someone with only a high school diploma. Its followers calculate this metric by comparing the median earnings of college graduates to those of high school graduates.
Typical examples are that the median college graduate earns $1.2 million more than a high school graduate over their lifetime, or that the median College graduate’s salary is 86% higher than that of a high school graduate. (1)
To fully understand the limitations of the college wage premium and why it can be misleading, read the next chapter: Why are the experts using the “College Wage Premium” when it is misleading?
Most of these studies measure the wrong period, ignore the costs of attending college, including the opportunity cost, ignore the tax impact on earnings, and ignore the time value of money.
A college is not necessarily a better investment even if its graduates earn higher incomes. One must consider the Cost of getting that degree and how one recoups those costs over time.
Don’t use the College Wage Premium to compare or choose a college.
Cost to Earnings Ratios or Payoff
Many variations of this measure attempt to compare Cost against earnings. Sometimes it’s calculated as a ratio. More typically, it is expressed as a payoff. That is a shortcut to figuring out how long it will take to pay back the college costs based on the salaries generated after graduation.
Here is a typical example:
Third Way calls their metric for understanding returns on investment the price-to-earnings premium (PEP).(2)
They claim the PEP indicates the total number of years the average student will take to regain their investment in attending a given college or university. Third Way calculates their PEP by dividing the total net price of the bachelor’s degree (assuming four years of tuition) by the difference between the median earnings of a former student from that college ten years after their enrollment and the median earnings of a high school diploma holder.
My alma mater, Baruch College, is the top-ranked school using this measure. The author says, “The top-performing institution on the PEP rank this year is the City University of New York’s (CUNY) Baruch College, an HSI in New York City, with a PEP of 0.2—meaning the typical Baruch student can recoup their tuition costs in fewer than three months.“
Baruch College is one of the best choices I can recommend. See the Chapter: Are wealthy families better off with their kids in Harvard or Baruch?
The PEP would not be the reasoning I would use. Here is why:
Almost all payoff calculations ignore the opportunity cost of attending college. They merely consider the attendance costs, such as tuition and fees. One would have to recoup the value of those foregone earnings to match a high school graduate.
The PEP does an admirable job of at least reducing the graduate salary by a high school graduate’s salary. Some versions of this measure do not. Still, the state high school salary should not be the benchmark. That makes the ratio specific to that state only.
The salaries used for college graduates are ten years after enrollment or six years after graduation. Few graduates will make as much when they first leave college, and a six-year career might have seen a job promotion. Yet, even a straight 2% annual salary increase implies a starting salary almost 13% lower.
All of this analysis ignores the impact of taxes. The simple reality is that you pay back those expenses with cash you earn after the government has taken its share of taxes. So, using gross salary understates the payback.
All of these analyses ignore the time value of money. Earnings occur well after the investments. To properly evaluate them, one must return those future earnings to a similar timeframe. We use a technique called the discount cash flow to do so. Using unadjusted earnings also understates the payback.
It is financial malpractice to give anyone the impression that a college investment could be paid back in 0.2 months, even if it were free. A population with limited financial literacy might interpret this hyperbole at face value.
The PEP or similar ratios can be beneficial, but understanding their implications requires a sophisticated financial understanding.
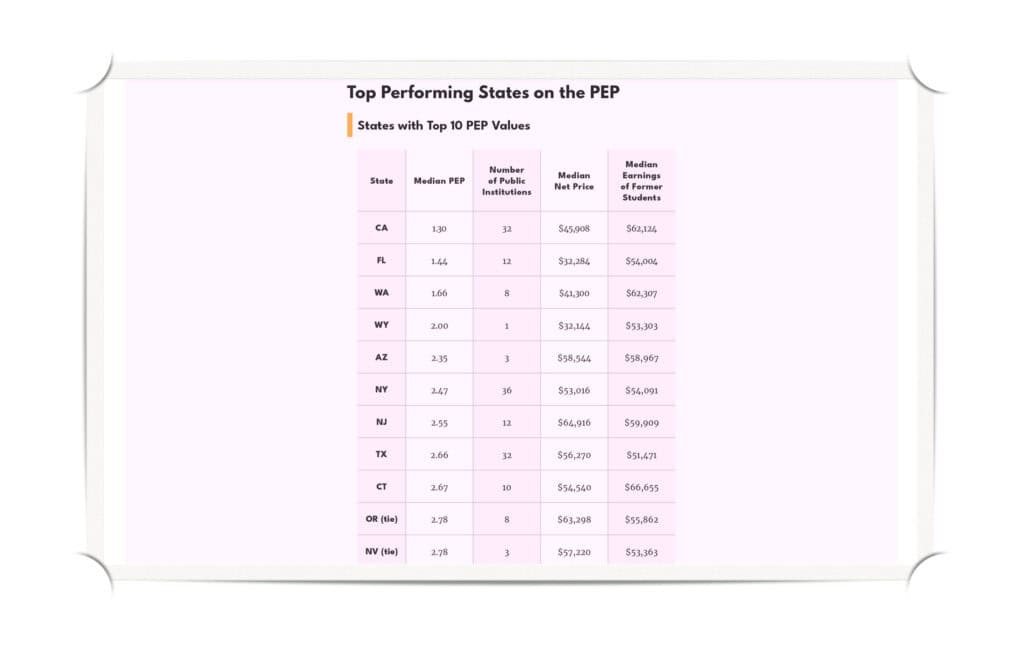
On this study’s summary page, the author provides a table ranking the States with the Top 10 PEPs.

California Colleges are ranked first with a PEP of 1.3. The median Student Net Cost is $46k, and the Median Salary is $62.1k. One assumes the authors used a State Median High School Salary of $27k, thus getting a PEP of 1.3 (Calculated by 46/(62-27)).
Florida Colleges are ranked second with a PEP of 1.44. Its median Student Net Cost is $32k, and the Median Salary is $54.0k.
That would make sense. Who would not willingly give up an extra $14k in Cost if you could get $8k more per year salary?
But look at the number three choice. Here, we see the problem inherent in payoff or ratio rankings.
Washington State has a PEP of 1.66, below the other two. Thus, its ranking.
Its median Cost is $41k, which is below the top-rated California.
Its median salary is $62.3k, higher than the top-rated California.
Washington is cheaper than California, and you earn more. Shouldn’t Washington be a better choice than California, regardless of that ratio?
Washington has a lower PEP because its state high school salaries are higher. This is a great example of why ratios and payoffs can be misleading. It also illustrates the problem with using state benchmarks for comparisons beyond the state..
Despite what the PEP shows, a student could attend Washington College, then move to California, and be better off than someone who studied at a California College.
Ratios such as payoffs do a poor job of understanding and highlighting the relative tradeoffs.
If you want to use a payoff, consider that your college payoff will never be better than the payoff for High School Graduates. The High School Graduate has no investment to pay off!
We do not recommend using these simplistic ratios in evaluating college investments.
Debt to Earnings Ratios
Many variations of this measure attempt to compare Debt against earnings.
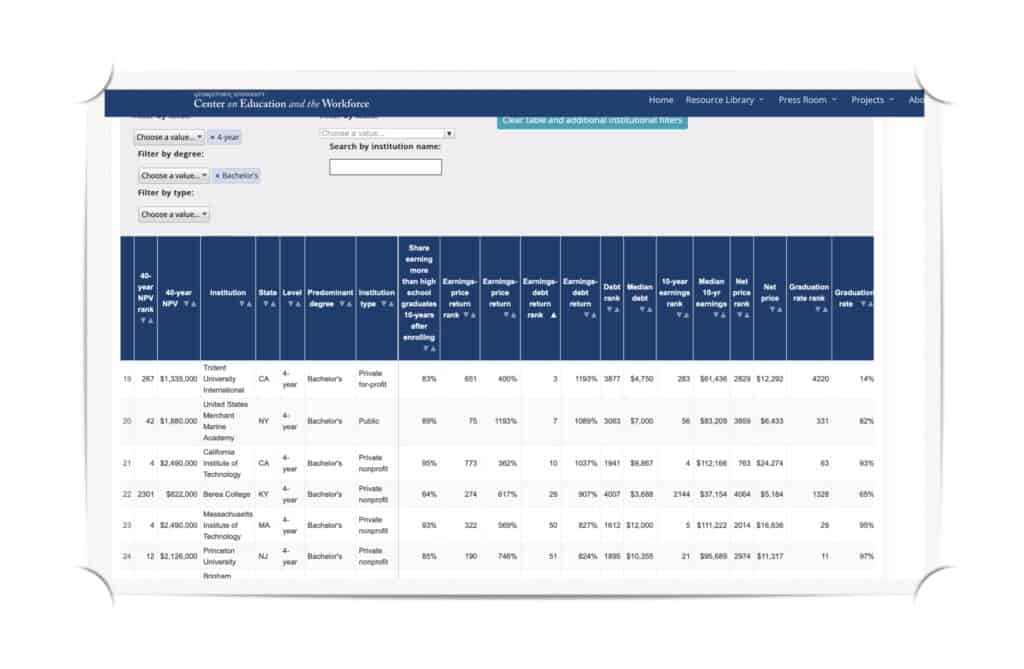
Here is a typical example by the Georgetown University CEW in their report Buyer Beware – First-year Earnings and Debt for 37,000 College Majors at 4,400 Institutions. (3)
“Student debt is a major issue in the United States, with overall federal student loan debt totaling more than $1.5 trillion. The average federal student loan debt per student at graduation from a four-year college is nearly $30,000. Thus, potential students and their families should be mindful of the amount of student loan debt they will have to assume to complete their chosen program.“
They evaluate college programs and highlight differences based on a graduate’s monthly loan payments and earnings.

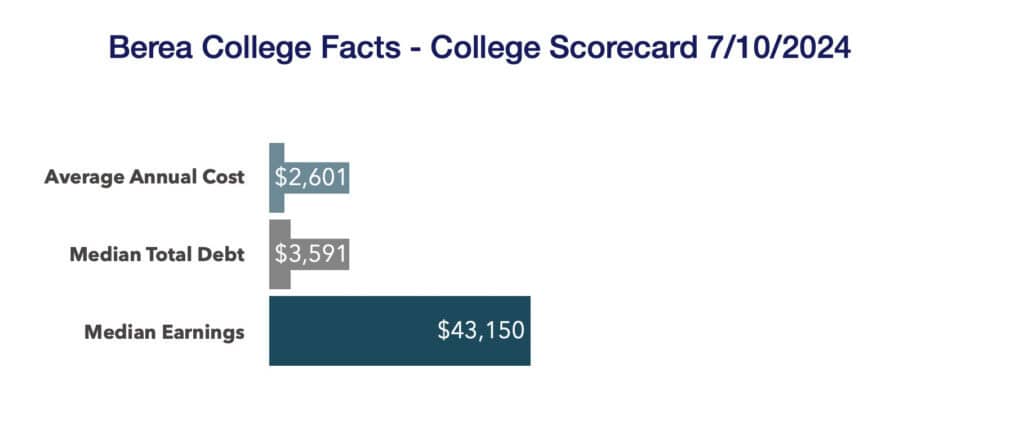
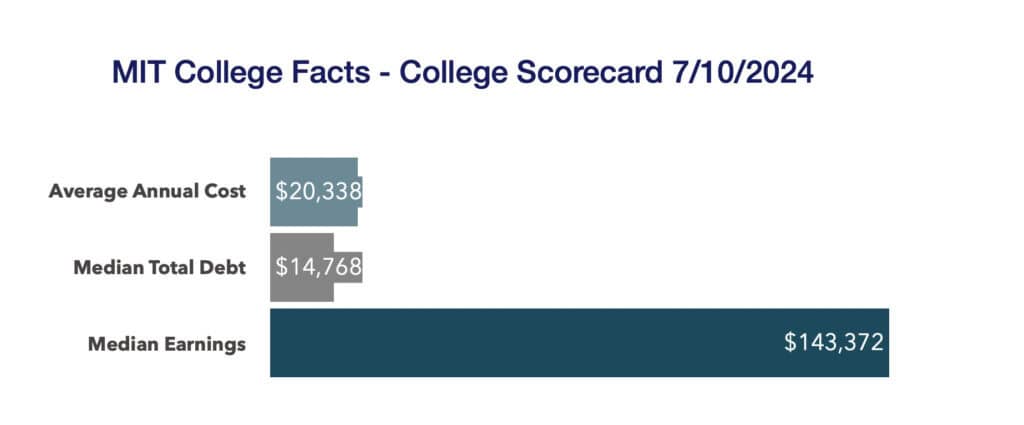
Look at the rankings on the attached image. Berea College is ranked above MIT. I will provide you with some additional facts below, and leave it to you, the reader, to decide which is the better choice.


These analyses presume that the level of Debt suggests something more about the value of a college degree than they do.
A college isn’t better or worse because its median student has high or low debt.
College debt is a result of three things:
- Consider the Cost of attending college. The higher the Cost, the more likely some financially challenged individuals will resort to Debt to fully fund attendance. Harvard’s total Cost is over $80k per year.
- Consider the federal and school aid levels provided to a prospective student, not requiring repayment. The median total Debt at Harvard is $14000. Typical monthly payments are $148. Only 3% of students receive federal loans. Most of their students are affluent and pay the total costs out of pocket. The financially challenged are receiving aid to minimize loans.
- Consider the financial situation of the student and their family. Lower-income families that cannot qualify for significant grants or scholarships sufficient to cover the costs resort to Debt.
Thus, when we use debt levels to compare colleges, we are using a multi-factor residual of the above three factors, the combination of which does not tell you whether one college is a better value than another.
Further, the level of debt of a given college does not necessarily say much about the specific student debt. Each student and their parent can use the cost calculators provided to find out the specific debt they will need to incur for any college.
Debt is a partial method of payment for costs. Parents should consider all costs, not just the part related to Debt.
Indeed, the best advice we should be giving parents, especially the financially challenged, is:
- Determine whether the field of study and college choice are a good investment.
- Do so using an NPV after costs and Taxes (NPVAT).
- A college choice is a good investment if the NPVAT is higher than that of a comparable high school graduate.
- Only consider Debt if the investment is a good choice.
Debt can be a good choice if the college choice has excellent returns. It is a disaster when the returns are subpar.
We like that the focus is on monthly income minus debt payments, but the average is not a very good predictor and should not be used for ranking choices.
Conclusion
We are exacerbating the college debt crisis by assuming that most college choices are suitable investments. Many are not.
The rush to provide better College ROI advice to parents and students has produced significant misleading research.
These financial metrics can be helpful, but the nuance in their application needs to be better understood by even the well-educated. Thus, college investors will make poor choices when considering these rankings or advice.
We need better financial literacy to help parents and students understand the implications of their choices!
Reference Sources
- The Association of Public and Land-grant Universities. “How does a college degree improve graduates’ employment and earnings potential?” Accessed on July 10, 2024. https://www.aplu.org/our-work/4-policy-and-advocacy/publicuvalues/employment-earnings/
- Rounds, Emily. “2023 Price-to-Earnings Premium for Four-Year Colleges.” Thirdway.Org. Third Way, September 28, 2023. https://www.thirdway.org/report/2023-price-to-earnings-premium-for-four-year-colleges.
- Georgetown University Center on Education and the Workforce, Buyer Beware: First-Year Earnings and Debt for 37,000 College Majors at 4,400 Institutions, 2020. https://cew.georgetown.edu/cew-reports/collegemajorroi/
- Georgetown University Center on Education and the Workforce, “Ranking 4,500 Colleges by ROI (2022).” Cew.Georgetown.Edu. https://cew.georgetown.edu/cew-reports/roi2022/.