In October 2026, USAFacts released its first “Just the Facts” debate, on the American Dream at 250. Steve Ballmer, who founded USAFacts, ran the fact desk, and one of his charts was about getting ahead.
Of children born to the poorest fifth of families, 7 percent made it into the top fifth in their thirties. Of children born into the top fifth, 39 percent “stayed there.”[1]
The moderator, Geoff Bennett of PBS NewsHour, summed it up this way: kids born poor rarely reach the top of the income ladder, “while kids born rich mostly stay there.” Then he asked Ben Shapiro whether that was “evidence of opportunity being hoarded or simply how mobility works in a market economy.”[1]
Shapiro said it was some of each, mostly the second, and that getting ahead is “an intergenerational process.” Scott Galloway said the smartest thing you can do is be born to rich parents, with “some people starting the marathon at the 20-mile mark.”[1]
Two sharp debaters answered the question. Neither questioned the premise that kids born rich mostly stay there.
So try it yourself. Seven percent of kids from the bottom make it to the top. Thirty-nine percent of kids from the top stay there. Is the game rigged?
It looks that way.
I think the premise was wrong. The numbers on the slide are accurate. The reading of the top was backward.
The whole table behind the slide shows most kids born at the top leave it, and most of that generation’s top grew up below it.
And the pattern is close to what a fair race looks like when the runners start in different places.
Let me show you, one step at a time.
What the chart measures
Start with who is in it. The chart covers about 21 million children born from 1978 to 1983, most of that generation. It is not a sample of college graduates. It counts everyone, whatever schooling they had.[2]
The researchers, Raj Chetty, Nathaniel Hendren, Maggie R. Jones, and Sonya R. Porter, used tax records to rank each person twice.[2]
The first ranking is where they started. The researchers took the parents’ household income while the children were growing up, averaged over five years between 1994 and 2000, when they were 11 to 22. They ranked each family against all other families with a child born the same year and split them into five equal groups, from the poorest fifth to the richest.
The second ranking is where they ended up. The researchers took each child’s own household income, their income plus a spouse’s, averaged over 2014 and 2015, when they were in their mid-thirties. They ranked each person against everyone else born the same year and split them into five equal groups again.
Each bar takes everyone who started in one group and shows the share who ended up in the top fifth. Take the first bar. Of the children whose parents were in the poorest fifth, 7.4 percent had household incomes in the top fifth in their mid-thirties. The last bar takes the children whose parents were in the top fifth: 39.4 percent of them were still there.[3]
The five groups start at different distances from the top.
Picture a race
Picture 100 runners on a 100-meter track. Split the track into five stretches of 20 meters, with 20 runners in each. The first stretch is the poorest fifth of families. The last stretch, the finish, is the richest fifth.
A runner in the fourth stretch has to pass 1 to 20 people to reach the last stretch. A runner in the first stretch has to pass 61 to 80. Some do.
In this race, your parents’ finish is your starting line, and your own household income in your mid-thirties is where you end up. Now read the five bars as a race. Each one asks how many runners from one stretch ended up in the last stretch.
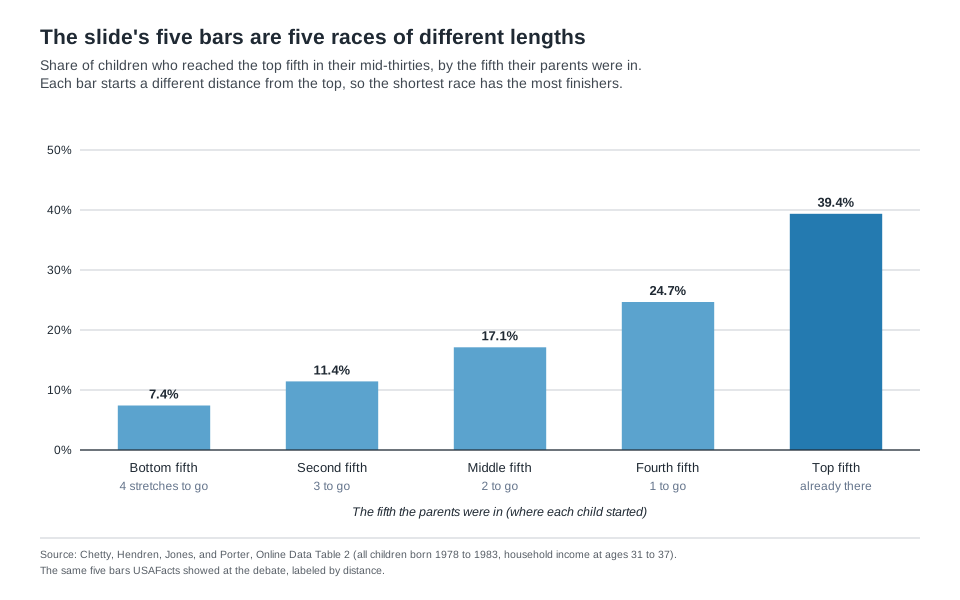
The bars are not five runners in the same race. They are five races of different lengths. Of course the shortest race has the most finishers.
Still not sure? Picture two equally fast runners. One is 10 meters from the last stretch. The other is 70 meters back. Which one is more likely to get there? The answer says nothing about whether the race is fair. It’s just distance.
Most of the top falls back
The slide showed one column of a bigger table. The researchers’ public data table shows where children from every stretch ended up.[3]
Start at the finish. If 39 percent of children born into the top fifth were still there, six in ten were not.[3] “Mostly stay there” is false on the slide’s own numbers.
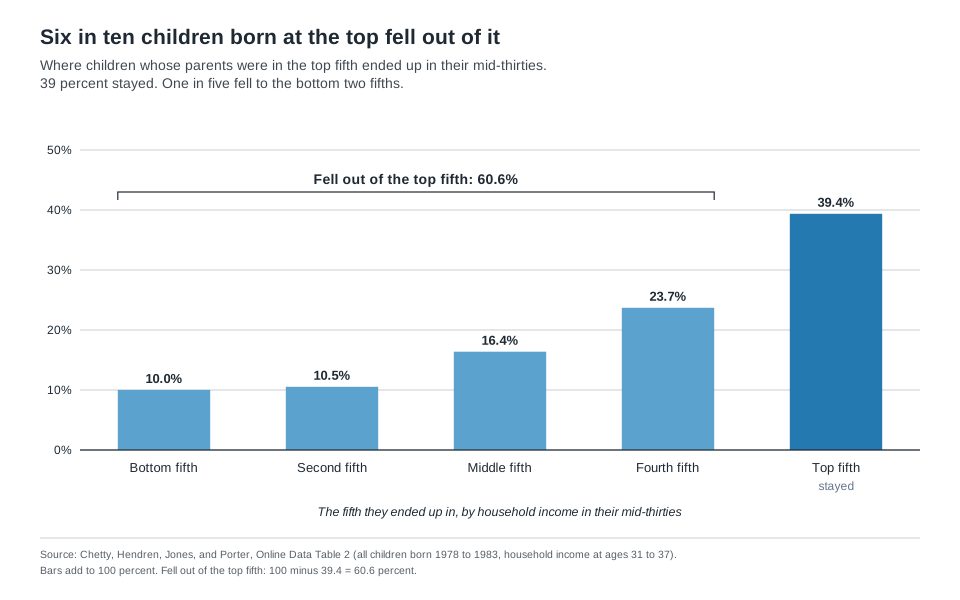
Every stretch holds the same 20 runners, so the same table shows where that generation’s top came from. Six in ten of the people in the top fifth started farther back.[3]
Nearly one in five of the top came from the first two stretches.[3] And one in five children born at the top fell to the first two stretches.[3]
Now the start. Of children born into the poorest fifth, two in three moved up.[3]
The two ends mean different things. Two in three moving up is good news for the bottom. Six in ten falling back is the risk that comes with the top.
Most of the top fifth turns over in a generation.
Same distance, same odds
A fair test compares the same distance from different starting points.
Take a climb of one stretch. Between one in five and three in ten runners make it, wherever they start. The last stretch into the top is easier than the two in the middle. Take a climb of two stretches. A little more than one in six make it, wherever they start (Table 1a).[3]
Table 1a. Climbs: same distance, about the same odds
| Climb | From the first stretch | From the second | From the middle | From the fourth |
|---|---|---|---|---|
| One stretch | 28.4% | 21.6% | 22.0% | 24.7% |
| Two stretches | 18.3% | 17.0% | 17.1% | |
| Three stretches | 12.1% | 11.4% | ||
| Four stretches | 7.4% |
Table 1b. Falls: same distance, about the same odds
| Fall | From the last stretch | From the fourth | From the middle | From the second |
|---|---|---|---|---|
| One stretch | 23.7% | 21.1% | 20.2% | 24.7% |
| Two stretches | 16.4% | 15.6% | 18.2% | |
| Three stretches | 10.5% | 13.3% | ||
| Four stretches | 10.0% |
Read across a row: the same distance from different starting points. Source: Chetty, Hendren, Jones, and Porter, Online Data Table 2.[3]
Falls roughly mirror climbs (Table 1b). A runner in the last stretch drops back a given distance somewhat less often than a runner in the first stretch moves up that far.
The one exception is the full distance: the fall from top to bottom (10.0 percent) is more common than the full climb (7.4).
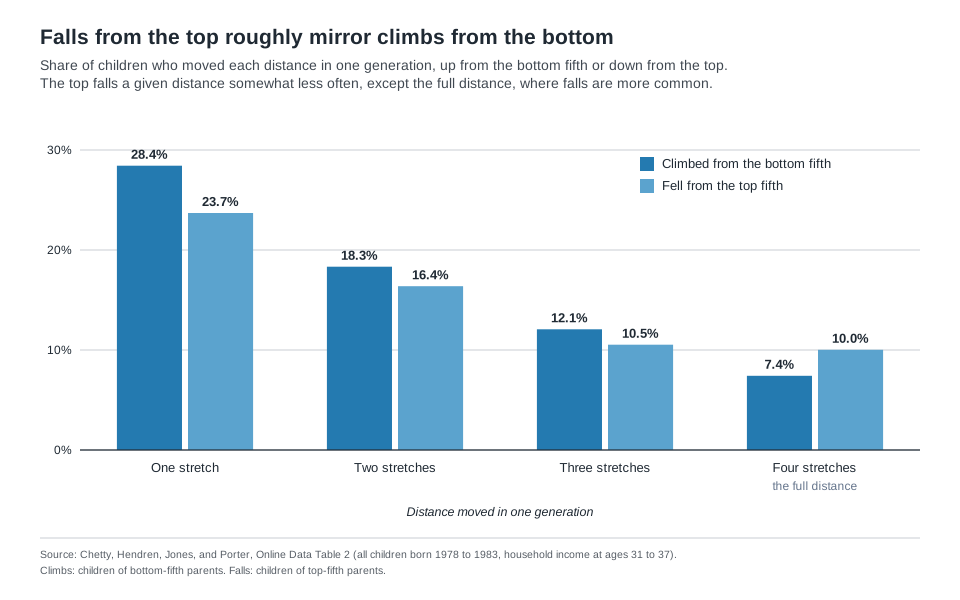
That is a better test for hoarding than the five bars. If the top were holding its place, its children would fall far less often than bottom children climb.
They fall somewhat less often, and over the full distance they fall more often.
Fair means the same odds for every stretch of track, up or down, wherever you stand.
So the gap between 7 percent and 39 percent is mostly distance to the finish. Galloway’s marathon picture is right about the start. What the table adds is that each stretch costs about the same, whoever runs it.
Twenty percent is the wrong yardstick
Ballmer set the yardstick at 20 percent. “If every kid had the same opportunity,” he said, the share from the bottom fifth reaching the top would be 20 percent. The note printed under the chart said it another way: “If every income group had an equal chance of moving up or down quintiles, each bar would be 20%.”[1]
Both get fairness wrong. Twenty percent in every bar would mean where you grow up counts for nothing at all.
The note also compares unlike things. Its condition talks about moving up or down quintiles, but the bars measure climbs of four stretches, three, two, one, and none.
Give everyone an equal chance of moving up or down a stretch at a time, and within a generation the bars shrink as the distance grows. That is the slope on the chart. The fair race below runs on exactly that rule.
The bars reach 20 percent only after many generations of shuffling.
It is the mistake I wrote about in Why We Keep Picking the Wrong Door. With two doors left, the odds look like fifty-fifty. With five stretches, the shares look like 20 percent each. Both times, intuition hands out equal shares and skips how the game is built: what the host knows there, where the runners start here.
Run a fair race
Paul Erdős, one of the great mathematicians of the last century, would not accept the Monty Hall answer until he watched a computer simulation.[4] So I built one.
If every runner kept the same pace, nobody would ever change places, and children would finish where their parents did. Places change because some runners pull ahead and some fall back, for all kinds of reasons: talent, effort, health, a lucky break, a layoff.
So here are the rules. In each round, in each stretch, one runner in five pulls ahead by a stretch, one in five falls back by a stretch, and the rest keep pace. Nobody can pass the finish or fall behind the start.
Every runner plays by the same rule.[5] That is a simple picture of a dynamic economy.
Run it for 13 rounds, and the fair race comes close to the real chart. From the first stretch, 7.5 percent of its runners reach the top, against 7.4 percent in the real one. The fit loosens as you move up, and the chart below shows it is farthest off at the top.[3][5]
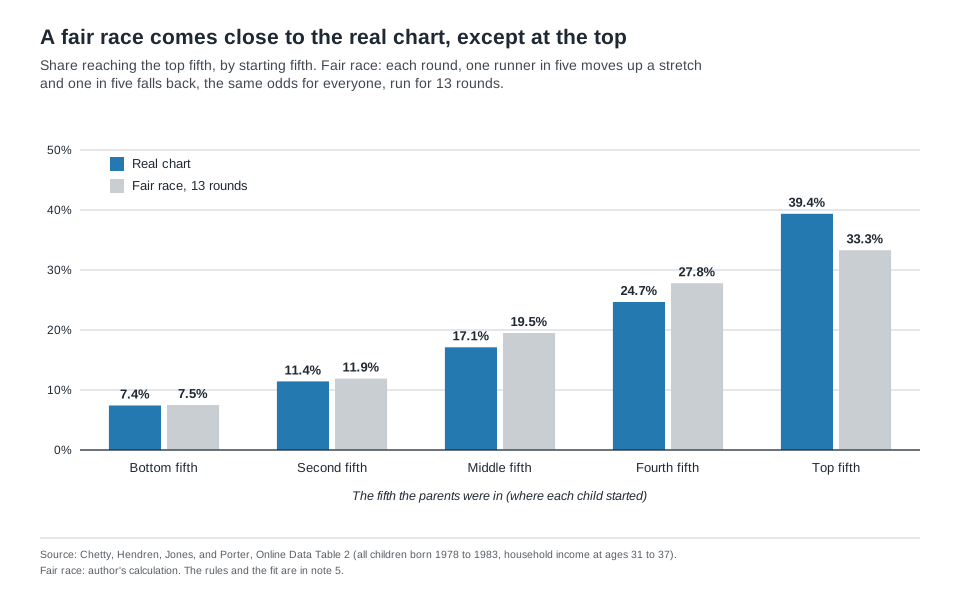
A round is not a set number of years. Smaller shuffles over more rounds give the same picture. One runner in eleven moving each way every year, for 30 years, about one generation, fits about as well.
What matters is the total amount of shuffling, and the real chart packs all of it into one generation.[5]
Think about what that means. The real chart rises with every stretch closer to the finish, close to the shape a fair race produces when runners start in different places. The exception is the top, where the real chart rises more steeply.
And the real race moves fast. The chart catches these runners in their early to mid-thirties, about 10 to 15 years into their working lives. By then, about 7 in 100 of those born at the bottom, roughly 300,000 children from this one generation, were already in the top fifth.[2][3] The real race is not stuck.
The biggest difference is at the top. Real children born there hold their place more often than the fair race predicts, and they fall all the way to the bottom more often too.[3][5]
A simple race is a rough yardstick, so I wouldn’t put much weight on the exact size of those gaps. What holds up is their direction. Every version of the race I ran keeps the top at about a third. A different simple model, described in note 5, comes closer, at about 37 percent. Both fall short of the real 39 percent.[5]
Holding the top more often is what you’d expect when some runners have better coaching, training, and gear behind them. That doesn’t explain the extra falls to the bottom, though. What stands out is how much movement there is anyway. Six in ten children born at the top still leave it.[3]
The pace has held steady, too. Chetty and four coauthors found rank-based measures of mobility “remained extremely stable for the 1971-1993 birth cohorts.”[6] A fair race running at a steady pace looks the same in every generation.
The same paper adds a warning. Because inequality has risen, the “birth lottery,” meaning the parents a child is born to, matters more. Its consequences “are larger today than in the past.”[6] In race terms, the odds of passing have not changed, but the stretches have moved farther apart in dollars.
The race has one limit. It takes the starting line as given, and a child’s starting line is the parents’ finish. Fair does not mean parents who can afford more should spend less preparing their children. It means that if you can run, nobody puts an artificial barrier in your way.
Where a child starts still matters, and my coming essay Heavier Gravity is about exactly that. What the table shows is that, from each starting point, the odds of moving a given distance are close to even in both directions, with the top somewhat stickier.
These are averages across all children. The researchers behind the chart find the course is not this even for every group, and that deserves its own essay.
Calling the gap between 7 and 39 percent hoarding reads it as a rigged course, when most of it is the distance to the finish.
The question worth arguing about
If the top is only somewhat stickier than a fair race, the exchange at the debate was about the smaller question. The bigger one is who helps children cover more ground.
Nationally, fewer than one in ten children born into the bottom fifth reach the top fifth.[3][7] College-goers do better than other children, so the fair test for a college is its peers.
Chetty and coauthors track students by college in their Mobility Report Cards. Among college-goers from the poorest fifth, 18.3 percent reached the top fifth of earnings in their early thirties.[7]
At Baruch College in New York, 46.8 percent of students from the poorest fifth of families reached the top fifth of earnings in their early thirties.[8] That is nearly half, about a decade into their working lives.
Across selective public colleges as a group, the share was 23.1 percent. Baruch doubled its peer group, the selective public colleges, and it beat the highly selective public colleges too, whose share was 40.7 percent.[8]
Those are raw shares, not proof that Baruch caused the climb. Students choose colleges, and colleges choose students. Still, a public college whose poorest students reach the top fifth twice as often as those at its peers, and this early in their working lives, is worth studying, and so is every other college doing the same.
Full disclosure: I graduated from Baruch, and I chair the Baruch College Fund Campaign Committee. The Baruch figures come from the public Mobility Report Card table.
The chart at the debate does not show a rigged game. It looks like a fair race with an inherited starting line and a somewhat sticky finish.
Arguing over whether the winners hoard does little for a runner at the start. Finding out why students at some colleges cover more ground than their peers might do a great deal.
Reference Sources
- USAFacts. “Just the Facts: Scott Galloway and Ben Shapiro Debate the American Dream.” YouTube, 14 Oct. 2026. Accessed October 15, 2026. The debate recording. Ballmer presents the mobility chart at about 3:30 to 4:20, Bennett frames it at about 7:20, Shapiro answers at about 7:40, and Galloway at about 9:00. Quotations are from YouTube’s English caption track for the video. The chart and its note are on page 5 of the debate deck USAFacts posted with the video.
- Chetty, Raj, Nathaniel Hendren, Maggie R. Jones, and Sonya R. Porter. “Race and Economic Opportunity in the United States: An Intergenerational Perspective.” Quarterly Journal of Economics, vol. 135, no. 2, 2020, pp. 711–783 (NBER Working Paper 24441, revised December 2019). Accessed October 15, 2026. Defines the sample: 21.3 million children born 1978 to 1983, about 94 percent of the children in the study’s target group (born in the United States or brought as authorized immigrants in childhood, with parents who were citizens or authorized immigrants). Children’s household income is the mean of 2014 and 2015, at ages 31 to 37. Parents’ household income is the mean of 1994, 1995, and 1998 to 2000, when the children were 11 to 22 (tax records for 1996 and 1997 are unavailable). Household income is the tax filer’s income plus a spouse’s, not a partner’s. Parents who did not file count as zero, and children who did not file count at their W-2 wages. Children are ranked against others born the same year, and parents against other parents of children born that year.
- Chetty, Raj, Nathaniel Hendren, Maggie R. Jones, and Sonya R. Porter. “Online Data Table 2: National Child and Parent Income Transition Matrices by Race and Gender.” Opportunity Insights, 2018. Accessed October 15, 2026. Row “All, P” (all children, both genders), columns kfr_q[i]_cond_par_q[j]: the share of children with parents in fifth j whose household income lands in fifth i. Every share about the real table in this essay comes from this row, which reproduces the slide’s five bars (7.4, 11.4, 17.1, 24.7, and 39.4 percent). Each fifth holds exactly 20 percent of children and of parents (the table’s marginal columns are all 0.2), so the share of top-fifth adults who grew up in fifth j equals the share of fifth-j children who reached the top. Author’s sums: six in ten leave the top, 100 − 39.37 = 60.63. Six in ten of the top grew up below it, 60.63. About one in five came from the bottom two fifths, 7.42 + 11.43 = 18.85. Two in three leave the bottom, 100 − 33.74 = 66.26. One in five of the top fall to the first two stretches, 10.02 + 10.53 = 20.55. Roughly 300,000 reached the top from the bottom: 21.3 million ÷ 5 × 7.42 percent ≈ 316,000, rounded down. Tables 1a and 1b read the same row by distance. The individual-income version of the same table puts the bottom-to-top share at 9.6 percent. Column definitions are in the table’s README. The paper’s main subject is racial gaps, and its race-by-race tables differ from this all-children row. This essay uses only the all-children row.
- Snider, Irvin. “Monty Hall, Paul Erdős, and Monte Carlo.” Midwest SAS Users Group Proceedings, 2010. Accessed September 25, 2026. Recounts how Erdős, one of the greatest mathematicians of the twentieth century, was convinced of the Monty Hall answer only after watching a computer simulation run by his friend Andrew Vázsonyi.
- Author’s calculation. The race model: five equal fifths (stretches). Each round, each person moves up one fifth with probability 0.2 and down one with probability 0.2, otherwise stays. Moves past either end stay in the end fifth. Everyone is re-ranked into equal fifths. Computed exactly as the one-round transition matrix raised to the power n, and checked with a simulation of 200,000 people re-ranked every round (the two agree within 0.6 points in every cell). At 13 rounds the root-mean-square gap across all 25 cells of the real table is 2.2 points, the smallest of any n, and 11 to 15 rounds all fit within 2.5 points. At 13 rounds, runners who started in the first stretch are spread 33.3, 27.8, 19.5, 11.9, and 7.5 percent across the five stretches, within 1.2 points of the real bottom fifth in every stretch. Top-fifth runners stay at 33.3 percent and fall to the first stretch at 7.5 percent, against 39.4 and 10.0 in the real table. A round has no fixed length: the fit depends on the total amount of shuffling. Odds of 0.10 each way need 26 rounds and odds of 0.30 need 8, with gaps of 2.1 and 2.3 points. Yearly rounds with odds of one in eleven each way fit 30 years with a gap of 2.1 points. Every version keeps the top at 33 to 34 percent. A second check: a one-generation model in which each child’s rank keeps part of the parent’s rank (a correlation of 0.38 between the two on a normal scale) and every child gets the same random luck on top fits the table with a gap of 1.7 points. It keeps 37.1 percent of top-fifth children at the top and sends 7.2 percent to the bottom, against 39.4 and 10.0 in the real table. Both models are symmetric by construction, so neither reproduces the top’s extra stickiness.
- Chetty, Raj, Nathaniel Hendren, Patrick Kline, Emmanuel Saez, and Nicholas Turner. “Is the United States Still a Land of Opportunity? Recent Trends in Intergenerational Mobility.” American Economic Review, vol. 104, no. 5, 2014, pp. 141–147 (NBER Working Paper 19844). Accessed October 15, 2026. Finds rank-based mobility “extremely stable” for children born from 1971 to 1993. Measured at age 26, the chance of reaching the top fifth from the bottom fifth was 8.4 percent for children born in 1971 and 9.0 percent for those born in 1986. Different ages and income years from note 3, so it is cited for the trend, not the level. Journal details from the NBER page.
- Chetty, Raj, John N. Friedman, Emmanuel Saez, Nicholas Turner, and Danny Yagan. “Mobility Report Cards: The Role of Colleges in Intergenerational Mobility.” NBER Working Paper 23618, July 2017. Accessed September 24, 2026. Ranks children born 1980 to 1982 by their individual earnings in 2014, at ages 32 to 34, against others in their birth cohort, and parents by household income when the child was 15 to 19. The paper’s Table I puts the share of all children from bottom-fifth families who reach the top fifth of earnings at 8.65 percent, and its text gives 18.3 percent for college-goers from the bottom fifth.
- Chetty, Raj, John N. Friedman, Emmanuel Saez, Nicholas Turner, and Danny Yagan. “Mobility Report Cards Online Data Table 2: Baseline Cross-Sectional Estimates of Child and Parent Income Distributions by College.” Opportunity Insights. Accessed September 24, 2026. Baruch College (CUNY Bernard M. Baruch College): kq5_cond_parq1 = 0.468, the share of its students from bottom-fifth families who reached the top fifth, par_q1 = 0.276, and mobility rate 0.129. Tier averages are the author’s calculation, weighting each college by its student count times its bottom-fifth share: selective public 23.1 percent, highly selective public 40.7 percent. Raw shares of attendees, not causal estimates.