An audition behind a screen
Picture an orchestra filling 100 seats. It holds auditions behind a screen, so the judges hear the playing and never see who is playing. A thousand men audition. Five hundred women do. Suppose more of the men are trying their luck, and more of the women are players who have prepared for years.
When the screen comes down, the orchestra has hired 50 men and 50 women. A woman who auditioned had twice the odds of a man, one in 10 versus one in 20.
Were the men cheated?
They couldn’t have been. The judges never knew who was behind the screen. The split came out even because as many women as men played at that level, from a line half as long.
The line outside the hall told you how many people wanted the job. It told you nothing about who could do it.
Hold that picture. On October 30, a physician named Anish Koka posted four lines about MIT:[1]
17,000 men apply to MIT
8900 women apply to MIT
600 men were accepted
612 women were accepted
He added that a sex-blind admissions process would produce that result about once in 4 × 10³¹ tries. When another user said men get in at higher rates at most other colleges, he replied, “Sure. But it’s technically illegal.”[2]
The next day Robby Starbuck quoted the post, added that “boys make up 61% of the top SAT scores,” and wrote, “It’s impossible for this to be merit based. Just mathematically impossible.”[3] By October 31, the two posts had drawn more than 1.6 million views between them.
Those are MIT’s own numbers, trimmed a little. MIT reports that for the class entering in fall 2024, 17,210 men and 8,975 women applied, and 606 men and 612 women were admitted.[4]
MIT’s numbers have the same shape as the audition. Half as many women applied, and each group got about half the places. Whether they share the reason is the question.
Koka’s math is right, and I’ll show why. Then I’ll show what that math measures, why it’s the wrong yardstick, what happens when you use it on other colleges, and what would settle the question.
His math is right. The coin is wrong.
Start with what he got right. Put Koka’s 25,900 applicants in a hat, 8,900 of them women, and draw 1,212 names at random. You’d expect about 416 women. Getting 612 or more by luck is a one-in-4 × 10³¹ shot. I reran his calculation and got the same answer.[5]
Now read the line he put between those four lines and the math: “If we assume male and female applicants to MIT are roughly the same.” His whole calculation rests on that assumption. He has since said women applicants probably aren’t that much stronger on quantitative measures, and that MIT could settle that by releasing the raw numbers.[6] He’s right that it could. MIT’s Common Data Set doesn’t report scores by sex, so neither his guess nor mine is measured. But those numbers would settle only the question about scores, and scores aren’t all MIT says it looks at.
The calculation treats every applicant as the same coin, with the same chance of being the kind of student MIT admits. Flip that coin 1,212 times and the class should look like the people who applied.
So the tiny number answers one question, whether MIT copied its applicant mix. Nothing says it had to, unless the two pools are identical. Run it on the audition and it convicts judges who never saw a face.
Who applies tells you who was interested, not who was qualified
An application is a choice. People apply for their own reasons: a love of engineering, a feel for a school’s culture, a guess at their odds, a parent’s hopes. Applying shows interest. It doesn’t certify readiness. An acceptance rate is admits divided by applications, so it moves with the length of the line, a point I made in The Ranking Trap.
MIT has said for years that far more applicants clear its bar than it can admit.
In 2012, MIT’s chancellor and three deans wrote, “There are many more fully qualified applicants than there is space for them; we might easily admit twice as many – or more – students as we do currently and not see a decrease in quality.”[7] Stu Schmill, MIT’s dean of admissions, put it plainly in 2022: “we simply don’t have the space to admit all the well-qualified and well-matched students who apply.”[8] Two years later he described MIT’s job as selecting “from among the well-qualified pool of applicants.”[9]
That’s MIT speaking for itself. In the same 2012 letter, its deans wrote that MIT “does not use target quotas, nor aim for particular distributions of groups,” and that it works “to enroll a critical mass of different groups.”[7] MIT’s word can’t settle the question, but it tells us what to test.
Once both groups hold more qualified people than there are seats, the length of the line stops mattering. What matters is who clears the bar and who stands out among them, and nothing says that mix has to match the applicants. That’s what happened behind the screen.
Self-selection may also make the women who apply a stronger slice of their group. If men near the bar apply more readily than women near it, the women who do apply will clear it more often than the men who apply.
One study points the same way. Looking at college applications in Chile, the researchers Paola Bordón, Catalina Canals, and Alejandra Mizala found that men applied to selective programs “even when they are marginal candidates,” while equally qualified women applied less often.[10] Chile isn’t MIT, so I read that as a possible pattern here, not a measured one.
What about Starbuck’s 61 percent? It most likely comes from a January 2025 report by the American Institute for Boys and Men.[11] That report found boys were 61 percent of the top tenth of scorers on the math section of the SAT. The College Board’s own 2023 table works out to about the same share on the combined score at 1400 and up, the top 7 percent of test takers: roughly 75,000 boys and 48,000 girls.[12]
MIT’s class sits at the top of that range, where boys’ share is likely higher still. Of its first-years who sent SAT scores, 98.8 percent scored 1400 or higher, and half scored 1550 or more.[4]
So if MIT picked on scores alone, from everyone who took the test, I’d expect a class that leans male. But MIT doesn’t pick from everyone who took the test. It picks from the people who applied, and not on scores alone. Starbuck’s number counts every test taker. Koka’s counts every man and woman who applied. Neither tells you how many women and how many men cleared MIT’s bar.
Run his rule on other colleges and it convicts them in both directions
If an admission-rate gap proves bias, it should prove it everywhere. So I pulled the same kind of report, the Common Data Set, from other colleges, for fall 2024 or fall 2025 (Exhibit 1).
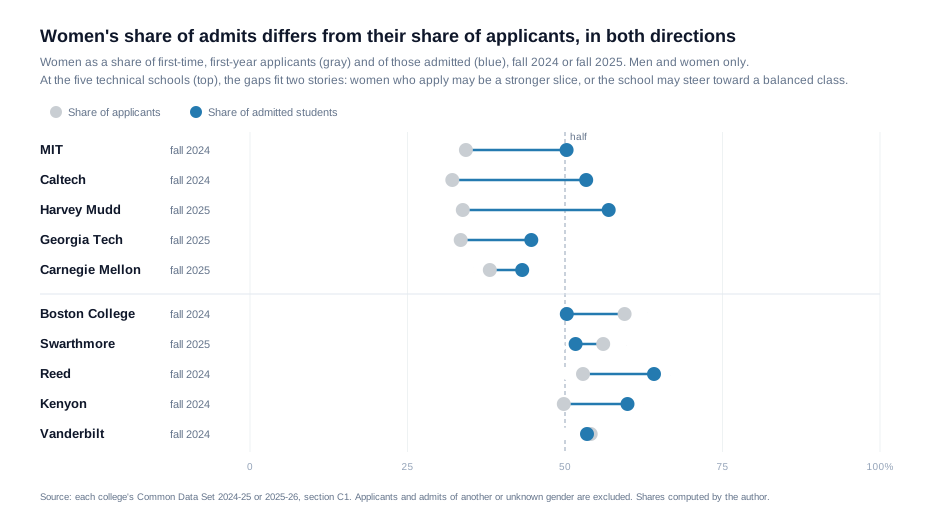
At technical schools, the pattern matches MIT. Women made up about a third of applicants at Caltech, Harvey Mudd, and Georgia Tech. They got in at higher rates: 4.3 percent versus 1.8 percent at Caltech, 20.7 versus 8.0 at Harvey Mudd, and 17.8 versus 11.1 at Georgia Tech.[13][14][15] Carnegie Mellon leans the same way, more narrowly, 12.6 versus 10.2.[16] By Koka’s rule, all four are biased against men.
Now flip the pool. At Boston College, about six in 10 applicants were women, and men got in at 19.9 percent versus 13.7 percent for women.[17] Swarthmore leans the same way, 8.3 versus 6.9.[18] By the same rule, those two are biased against women.
Even the smaller-group pattern doesn’t always hold. At Reed, where more women than men applied, women still got in at the higher rate, 28.3 percent versus 17.8.[19] At Kenyon, where the two groups were nearly equal, women got in at 37.3 percent versus 24.8.[20] Vanderbilt came out even.[21] Rate gaps move with who applies, what a college teaches, and much else an applicant count can’t see.
A rule that flags nearly every college I checked, whichever way its pool leans, can’t tell a fair one from a biased one.
The admitted classes show one more thing. At Caltech, Harvey Mudd, Georgia Tech, and Carnegie Mellon, women were a third to four in 10 of applicants but 43 to 57 percent of those admitted.[13][14][15][16] That fits two stories. The women who apply to those schools may be a stronger slice than the men, or the schools may steer toward a balanced class. These rates can’t tell the two apart.
At least one college has said it weighed sex. In 2006, Kenyon’s admissions dean, Jennifer Delahunty Britz, wrote in The New York Times that her college drew many more women applicants than men, which made the men “more valued applicants,” as Inside Higher Ed reported.[22]
What told us about Kenyon in 2006 was a dean describing how her office chose.
The fair test is how the class was chosen
So what would settle it? Here is the standard I’d hold any college to. Set one bar. Apply it the same way to everyone. Look at the whole person. Give sex no weight, as a plus or as a minus, and the same for race.
A class that comes out close to half women can meet that test. The mix can be a result rather than a target. An MIT admissions officer argued as much in 2011, in a comment under a blog post MIT has since archived: the class numbers “are the result, not the determinant, of the process.”[23] Whether that still describes how MIT chooses is a fair question. Koka’s numbers can’t answer it.
Rank order isn’t the test either. A score measures one thing. It’s an important thing, and at a school like MIT it’s the base standard, but it isn’t the only useful measure of a person. A college that admitted strictly by score would fill its class with its 1,200 highest scorers and lose any say over the mix of talents, interests, and backgrounds it brings together. No school or company should have to choose people on one number.
MIT says it doesn’t. The 2012 letter I quoted above is titled “Excellence has many dimensions,” and it says academic excellence “provides one element of selecting a class.”[7] Schmill wrote in 2022 that once MIT has established an applicant is prepared, it doesn’t consider scores at all.[8] That’s MIT’s word again, and it’s what a fair process would have to live up to.
So the orchestra was the easy case. Those judges weighed one thing, the playing, and the coin still got them wrong. Suppose MIT released its scores tomorrow and the men it turned away had outscored the women it took. That wouldn’t show the women were favored. They may have stood out on something else, or sex may have counted. Scores can’t tell those two apart.
The softer the measure, the easier it is to hide a thumb on the scale. That’s why the test is how a college uses those measures.
One large study gives those measures a hard time. At Ivy-Plus colleges, applicants with higher non-academic ratings did no better than comparable applicants at reaching top incomes, elite graduate schools, or prestigious firms, while test scores predicted all three.[24] That’s a fair challenge to how much those ratings should count. That finding isn’t about sex.
Koka’s math assumes two identical pools, and Starbuck’s 61 percent works only if merit means rank order and MIT’s applicants look like everyone who took the SAT. MIT describes something else. Schmill told MIT News in 2024 that MIT has “considered only applicants who meet our extremely high threshold of academic readiness,” and then chooses among them.[9]
On “technically illegal”: the federal ban, Title IX, covers sex discrimination in admissions only at vocational, professional, and graduate schools and at public colleges.[25] It doesn’t reach undergraduate admissions at a private college like MIT. So a private college that steers its undergraduate class toward balance isn’t breaking that law.
My standard asks more than the law does. When the Supreme Court ruled against race-conscious admissions at Harvard and the University of North Carolina in 2023, it wrote, “College admissions are zero-sum. A benefit provided to some applicants but not to others necessarily advantages the former group at the expense of the latter.”[26] I’d apply that same logic to sex.
The best outside evidence on how a class was chosen is how its students do once they arrive. If MIT were admitting women over a lower bar, you’d expect them to struggle more. Federal data on earlier classes show no sign of that.
Among first-time, full-time students, MIT’s women finished a bachelor’s degree within six years at a higher rate than its men in every class that entered from 2007 through 2018. For the class that entered in fall 2018, it was 97.3 percent versus 95.6.[27]
That’s supporting evidence, not proof. Rates this high leave little room to show a gap. And women finish ahead of men at other colleges too. At colleges that admit fewer than one applicant in four, women led by 2.5 points for the class that entered in 2017, 93.7 percent versus 91.2.[28] MIT’s women led by the same 2.5 points that year.[27]
Back to the audition
Suppose someone ran Koka’s math on the orchestra. They’d get odds of about one in 3,700, and they’d be accusing judges who never saw a face. To show the women were favored, they’d have to look behind the screen and find a stronger player turned away.
MIT has no screen, so the question is fair to ask. But a skewed number is a question, not a verdict. The question to ask of any college is how it chose its class.
Reference Sources
- Koka, Anish. Post on X. October 30, 2026. Accessed October 31, 2026. The four lines, the stated assumption (“If we assume male and female applicants to MIT are roughly the same”), and “The probability of a sex blind admission process creating this result is 1 in 4 × 10³¹”. The post showed 1.2 million views at capture.
- Koka, Anish. Reply on X. October 30, 2026. Accessed October 31, 2026. “Sure. But it’s technically illegal. Do we just pick and choose what laws to enforce?” The reply answers a post saying men are admitted at higher rates at most other colleges.
- Starbuck, Robby. Quote post on X. October 31, 2026. Accessed October 31, 2026. “It’s even worse than Anish notes here because boys make up 61% of the top SAT scores. … It’s impossible for this to be merit based. Just mathematically impossible.” At capture, Koka’s post showed 1.2 million views and this one 633,100, together about 1.8 million, so ‘more than 1.6 million’ holds.
- MIT Institutional Research. “2024-25 Common Data Set.” Accessed October 31, 2026. Section C1, first-time, first-year students, fall 2024: 17,210 men and 8,975 women applied, 606 men and 612 women were admitted. Another 997 applicants of another gender and 1,050 of unknown gender are not in Koka’s figures or in the rates here. Admission rates computed: men 3.5 percent, women 6.8 percent. Section C9: of first-year students who submitted SAT scores, 98.80 percent had a composite of 1400 to 1600. The 25th, 50th, and 75th percentile composites were 1520, 1550, and 1570. C9 reports scores for the whole class, not by sex.
- Author’s calculation. Hypergeometric probability of drawing 612 or more women in 1,212 admits from Koka’s pool of 25,900 applicants (8,900 women), each applicant equally likely to be drawn: expected women = 1,212 × 8,900 ÷ 25,900 = 416.5. P(X ≥ 612) = 2.35 × 10⁻³², or about 1 in 4.3 × 10³¹. On MIT’s exact figures (26,185 applicants, 8,975 women, 1,218 admits), expected women = 417.5 and P = 6.4 × 10⁻³², about 1 in 1.6 × 10³¹. Computed with scipy.stats.hypergeom. Orchestra example: 1,500 applicants, 500 of them women, 100 hired. P(50 or more women) = 0.000267, about 1 in 3,700.
- Koka, Anish. “Anish Koka, MD (@anish_koka) / X.” Post of October 31, 2026, as shown on his profile page. Accessed October 31, 2026. “I’m seeing a lot of responses suggesting female applicants could be just that much better to account for their higher acceptance rates at MIT. That’s probably not true by quantitative metrics, though MIT could very easily just release some raw numbers …” (the profile page cuts the post off at “Show more”).
- Grimson, W. Eric L., Daniel E. Hastings, Christine Ortiz, and Chris Colombo. “Excellence has many dimensions.” MIT, February 21, 2012. Accessed October 31, 2026. Letter from MIT’s chancellor and three deans stating the qualified pool is far larger than the class and that MIT could admit twice as many without a loss of quality. The letter calls academic excellence “critical and required” and one element of selecting a class.
- Schmill, Stu. “We are reinstating our SAT/ACT requirement for future admissions cycles.” MIT Admissions, March 28, 2022. Accessed October 31, 2026. The dean of admissions: MIT lacks space to admit all the well-qualified and well-matched students who apply. The same post says MIT does not consider scores “beyond the point where preparedness has been established.” MIT marks this post as an archived historical post, not maintained as a source of current MIT admissions policy.
- MIT News. “Q&A: Undergraduate admissions in the wake of the 2023 Supreme Court ruling.” August 21, 2024. Accessed October 31, 2026. Dean of Admissions Stu Schmill on selecting “from among the well-qualified pool of applicants” and on considering “only applicants who meet our extremely high threshold of academic readiness.”
- Bordón, Paola, Catalina Canals, and Alejandra Mizala. “The gender gap in college major choice in Chile.” Economics of Education Review, vol. 77, 2020, article 102011. Accessed October 31, 2026. Using Chile’s centralized admission system, the authors find men apply to selective programs “even when they are marginal candidates, while equally qualified female candidates tend to apply less often to these programs.”
- American Institute for Boys and Men. “Boys, girls, and grades: Examining GPA and SAT trends.” January 2025. Accessed October 31, 2026. Using SAT data for students who graduated high school in 2023: boys were 61 percent of the top decile on the SAT math section, 57 percent of the top decile and 56 percent of the bottom decile on the combined score.
- College Board. “SAT Suite of Assessments Annual Report: Total Group, 2023.” 2023. Accessed October 31, 2026. 1,913,742 students in the class of 2023 took the SAT. Total score 1400 to 1600: 7 percent of all test takers, including 5 percent of 966,726 girls and 8 percent of 936,481 boys. Author’s calculation from those rounded percentages: about 48,300 girls and 74,900 boys, so boys are about 61 percent (the rounding allows 57 to 65). The MIT figures in note 4 are for the class entering in fall 2024, a year later.
- California Institute of Technology. “Common Data Set 2024-2025.” May 2025. Accessed October 31, 2026. Section C1, fall 2024: 9,401 men and 4,446 women applied, 166 men and 190 women admitted. Admission rates computed by the author: 1.8 and 4.3 percent.
- Harvey Mudd College. “Common Data Set 2025-2026.” Accessed October 31, 2026. Section C1, fall 2025: 3,452 men and 1,761 women applied, 276 men and 365 women admitted. Admission rates computed by the author: 8.0 and 20.7 percent.
- Georgia Institute of Technology. “Common Data Set 2025-2026.” June 3, 2026. Accessed October 31, 2026. Section C1, fall 2025: 44,517 men and 22,363 women applied, 4,937 men and 3,983 women admitted. Admission rates computed by the author: 11.1 and 17.8 percent. Georgia Tech is public.
- Carnegie Mellon University. “Common Data Set 2025-2026.” Updated June 11, 2026. Accessed October 31, 2026. Section C1, fall 2025: 21,054 men and 12,942 women applied, 2,140 men and 1,628 women admitted. Admission rates computed by the author: 10.2 and 12.6 percent.
- Boston College. “Common Data Set 2024-2025.” Accessed October 31, 2026. Section C1, fall 2024: 14,099 men and 20,674 women applied, 2,800 men and 2,832 women admitted. Admission rates computed by the author: 19.9 and 13.7 percent.
- Swarthmore College. “Common Data Set 2025-26.” Accessed October 31, 2026. Section C1, fall 2025: 5,709 men and 7,286 women applied, 472 men and 505 women admitted. Admission rates computed by the author: 8.3 and 6.9 percent.
- Reed College. “Common Data Set 2024-25, Section C.” Accessed October 31, 2026. Section C1, fall 2024: 4,099 men and 4,597 women applied, 729 men and 1,303 women admitted. Admission rates computed by the author: 17.8 and 28.3 percent. Another 735 applicants of another gender are not in these rates.
- Kenyon College. “Common Data Set 2024-25.” Accessed October 31, 2026. Section C1, fall 2024: 3,872 men and 3,843 women applied, 959 men and 1,434 women admitted. Admission rates computed by the author: 24.8 and 37.3 percent.
- Vanderbilt University. “Common Data Set 2024-2025.” Accessed October 31, 2026. Section C1, fall 2024: 20,851 men and 24,553 women applied, 1,238 men and 1,424 women admitted. Admission rates computed by the author: 5.9 and 5.8 percent.
- Jaschik, Scott. “Affirmative Action for Men.” Inside Higher Ed, March 26, 2006. Accessed October 31, 2026. Reports Jennifer Delahunty Britz’s New York Times op-ed of March 2006: Kenyon received far more applications from women, and men were “more valued applicants.” Also notes Title IX’s exemption for private undergraduate admissions.
- Peterson, Chris. “Diversity or Merit?” MIT Admissions, October 13, 2011 (archived), comment of October 17, 2011. Accessed October 31, 2026. In a reader comment thread, the MIT admissions officer writes that the published class percentages are “the result, not the determinant, of the process.” His full sentence: “I’d argue that it’s much more due to the latter than to the former: that the data are the result, not the determinant, of the process.” MIT marks the post as archived and not current policy.
- Chetty, Raj, David J. Deming, and John N. Friedman. “Diversifying Society’s Leaders? The Determinants and Causal Effects of Admission to Highly Selective Private Colleges.” Published in the Quarterly Journal of Economics, February 2026. Circulated as NBER Working Paper 31492, July 2023, revised August 2025. Accessed October 7, 2026. Comparing Ivy-Plus applicants and adjusting for the college attended, the authors find those with higher non-academic ratings have “equivalent or lower chances” of reaching the upper tail of incomes, an elite graduate school, or a prestigious firm, and that SAT and ACT scores are “highly predictive” of those outcomes. The study holds ratings for Ivy-Plus colleges, and ratings differ by college.
- Legal Information Institute. “20 U.S. Code § 1681 – Sex.” Cornell Law School. Accessed October 31, 2026. Section 1681(a)(1): in admissions, Title IX applies “only to institutions of vocational education, professional education, and graduate higher education, and to public institutions of undergraduate higher education.”
- Supreme Court of the United States. “Students for Fair Admissions, Inc. v. President and Fellows of Harvard College.” 600 U.S. 181, June 29, 2023. Accessed October 31, 2026. Majority opinion: race-conscious programs “cannot be reconciled with the guarantees of the Equal Protection Clause,” and the zero-sum passage quoted here.
- Urban Institute. “Education Data Portal: IPEDS graduation rates, MIT (unitid 166683), 2023.” Accessed October 31, 2026. Federal IPEDS data for first-time, full-time bachelor’s-seeking students, completion within 150 percent of normal time (six years). Entry cohort fall 2018: men 541 of 566, women 532 of 547. Rates computed by the author: 95.6 and 97.3 percent. Entry cohort fall 2017 (survey year 2022): men 562 of 592, women 493 of 506. Rates computed by the author: 94.9 and 97.4 percent. The same query for survey years 2012 through 2023 (entry cohorts 2007 through 2018) shows a higher rate for women in all 12. Survey years 2012 through 2022 use the same address with the year changed: year 2012, year 2013, year 2014, year 2015, year 2016, year 2017, year 2018, year 2019, year 2020, year 2021, year 2022. Codes: sex 1 = male, 2 = female, per the portal’s codebook. IPEDS reporting is “mandatory for any institution that participates in … any federal financial assistance program authorized by Title IV,” per NCES’s IPEDS survey methodology page.
- National Center for Education Statistics. “Table 326.10. Graduation rate from first institution attended for first-time, full-time bachelor’s degree-seeking students at 4-year postsecondary institutions.” Digest of Education Statistics 2024, December 2024. Accessed October 31, 2026. 2017 entry cohort, within six years: all four-year institutions, men 60.9 and women 67.5 percent. Institutions accepting less than 25 percent of applicants, men 91.2 and women 93.7 percent.