You’ve probably seen some version of this line about Proposition 40, California’s billionaire tax. It’s only 5 percent. Why won’t billionaires pay that for the roads, schools and courts that helped make them rich?
The instinct behind it is fair. Public roads, courts, schools and trained workers do help businesses grow. Asking the people who did best to give something back is a reasonable question.
But the slogan skips one question. Five percent of what?
Most of us hear “5 percent” the way we hear a tax rate, a small slice of a year’s pay. Proposition 40 isn’t a slice of a year’s pay. It’s a slice of most of what a person owns. That changes how big the bill is, what it gets paid with, and what it can fix.
I’ll take the slogan one phrase at a time: how big “only 5 percent” is, what billionaires would pay it with, what California’s top earners already pay, and what the money would and wouldn’t change. This isn’t advice on how to vote. In California’s Tax Paradox, I looked at the chart that makes the state’s taxes look flat. This piece looks at the slogan.
Five percent of a fortune is not five percent of a paycheck
Start with what the measure taxes. Proposition 40 would charge a one-time tax of 5 percent of a billionaire’s net worth, meaning everything they own minus their debts. It reaches people who lived in California on January 1, 2026, with their wealth valued as of December 31, 2026. Real estate, pensions and retirement accounts would generally be left out.[1][2]
The tax phases in. Someone worth exactly $1 billion would owe nothing. The rate climbs to the full 5 percent at $1.1 billion, and from there it applies to the whole fortune, not only the part above $1 billion.[1] So the simple way to think about it is $50 million for every $1 billion of net worth. A person worth $2 billion would owe $100 million.
Now put that in the units most of us use. If 5 percent were a tax on income, a person would need $1 billion of income in a single year to owe $50 million.
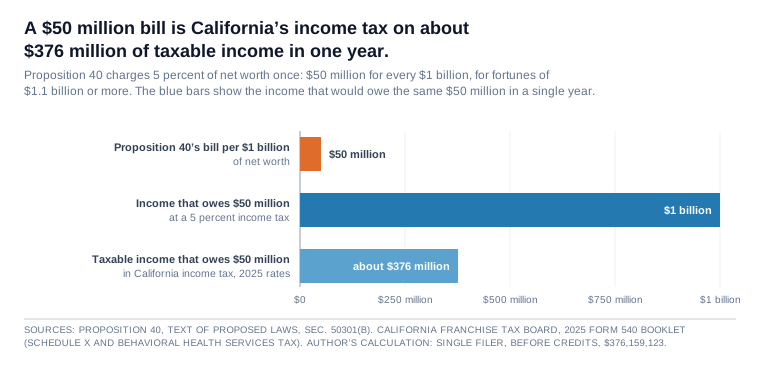
California’s own income tax gives a better yardstick. Its top rate is 12.3 percent, plus 1 percent on taxable income over $1 million, about 13.3 percent at the top.[3] At those rates, California’s income tax reaches $50 million at about $376 million of taxable income in one year, as Exhibit 1 shows.[3] Income is only one yardstick. A fortune also grows, which I come back to below.
A smaller, made-up example shows the same gap. Picture the owner of a family business worth $2 million that pays its owner $150,000 a year. A 5 percent tax on that pay is $7,500. A 5 percent tax on the business is $100,000, two-thirds of a year’s pay. Same 5 percent, very different bill. Proposition 40 would never reach this owner. The point is the arithmetic.
One trap is easy to fall into. You might set 5 percent beside the 8.8 percent of income that California’s top 1 percent pays in state income tax, by the Institute on Taxation and Economic Policy’s estimate. But the 8.8 percent is a share of a year’s income, for a group whose average income is about $2.1 million.[4] The 5 percent is a share of a fortune, for a few hundred people worth $1 billion or more.[2] Different base, different group.
“Only” is doing the work in the slogan.
A fortune is mostly shares, so the bill is usually paid with them
Most of what the richest households own is not cash.
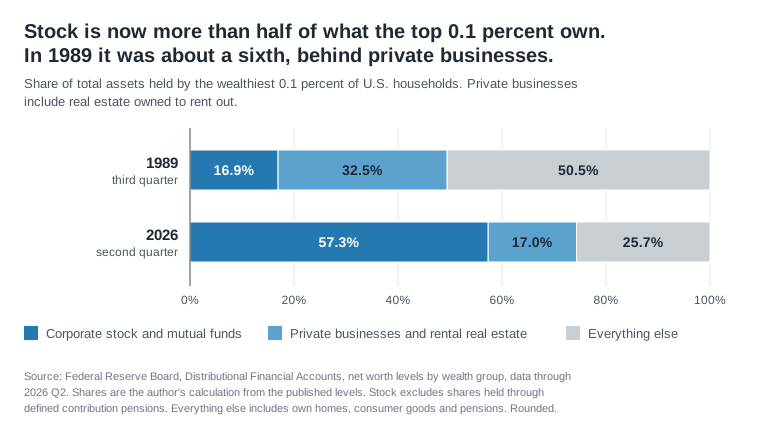
In mid-2026, by the Federal Reserve’s estimates, corporate stock and mutual funds made up about 57 percent of the assets of the wealthiest 0.1 percent of American households. Privately held businesses, along with real estate owned to rent out, made up another 17 percent. That’s nearly three-quarters together, up from about half in 1989, as Exhibit 2 shows. The mix changed too. In 1989, private businesses and rental property were the larger part. Now stock is.[5]
The same estimates show how fast that wealth grows. The wealth held by the richest 0.1 percent of households, taken as a group, grew more than 7 percent a year on average over the last 20 years, and nearly 10 percent over the last 10, before inflation.[5]
So the size of “only 5 percent” depends on the yardstick. Against a year’s income, it is a huge bill. Against a year’s growth, it is less than one average year. The tax takes 5 percent once, and this group’s wealth grew more than 7 percent in an average year. So in an average year, the growth alone would more than cover the bill, though not every year is average.
The Fed’s figures cover the top 0.1 percent nationwide, a far larger group than billionaires, and they don’t separate stock in a company the owner founded from other shares. But they fit what California’s Legislative Analyst says about the state’s billionaires. Many, it writes, “gained their wealth as executives or investors in California technology companies.”[2]
So paying $50 million usually means selling shares or borrowing against them.
The measure offers two ways to spread the bill. Anyone can pay in five yearly installments, with a charge of 7.5 percent a year on the unpaid balance.[1] People whose tax would be more than all their publicly traded holdings can choose a deferral account instead. They then pay 5 percent of the value of what they later sell or take out of the holdings they put in the account.[1]
Either way, the bill comes out of the fortune itself, now or later.
I’ve seen how a tax on paper value can go wrong. During the first internet boom, friends of mine received large option packages that everyone counted as part of their wealth. Because of how some were granted, they owed income tax on that value and made large payments to the tax authorities. Then many of those high-flying firms disappeared, and the options ended up worthless. The tax bill didn’t disappear with them.
Proposition 40 carries a version of that risk. The bill is set by what a fortune was worth on December 31, 2026.[1] Paid in installments, it stays the same if the shares fall later. The deferral account, which follows later prices, is open only to people whose tax would be more than all their publicly traded holdings.[1] So someone whose fortune is mostly public stock can’t use it. If that fortune later lost half its value, a bill set at 5 percent would come to 10 percent of what was left. It works the other way too. If the fortune doubled, the bill would come to 2.5 percent.
The strongest case for the tax starts with those same shares. Much of a billionaire’s fortune is gains that have never been taxed. As ProPublica put it, “if a taxpayer hasn’t sold anything, there is no income and therefore no tax,” and the very richest “typically hold fast to shares in the companies they’ve founded.”[6]
Two estimates put numbers on it, each by its own definition. ProPublica found that the federal income taxes the 25 richest Americans paid from 2014 to 2018 came to 3.4 percent of how much Forbes estimated their wealth grew.[6] Put another way, for every $100 their wealth grew, they paid about $3.40 in federal income tax. White House economists Greg Leiserson and Danny Yagan counted untaxed gains as income and put the 400 wealthiest families’ average federal income tax rate at 8.2 percent for 2010 to 2018, or 6 to 12 percent under other assumptions.[7] Both are federal, national figures. And both measure tax against what these fortunes gained, not against the fortunes themselves. So neither one lines up with Proposition 40’s 5 percent, which is a share of the whole fortune.
On that reading, 5 percent is a catch-up on gains the income tax never reached. That’s a real argument, and a different one from “only 5 percent.” It says, in effect, tax the whole fortune once to reach those gains, and collect it from the fortune itself. Voters can weigh that on its own terms. The slogan hides it behind a small number.
California’s top earners already carry much of its income tax
The second half of the slogan raises a fair question. What do the people at the top already pay toward what the state provides? In the state budget’s own words, “The highest-income Californians pay the largest share of the state’s personal income tax.”[8]
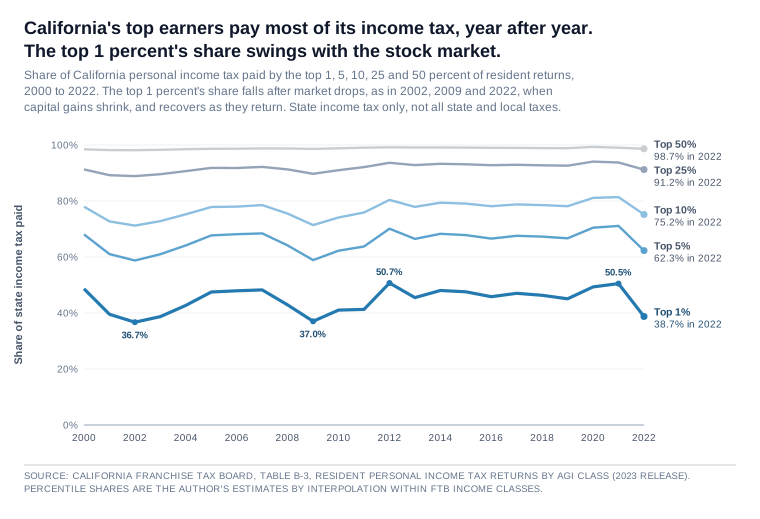
In Exhibit 3, the lowest line is the top 1 percent of earners. They paid more than 40 percent of resident personal income tax in 17 of the 20 years through 2021. They paid 50 percent in 2021 and nearly 39 percent in 2022.[8] Those are shares of one tax. That tax, the personal income tax, is in turn the state’s largest source of revenue, an estimated 67 percent or more of General Fund revenue in 2023-24.[8]
That top 1 percent was more than 170,000 tax returns in 2022.[8] Billionaires are a few hundred people.[2] So these shares don’t show what billionaires pay on their own, and as the last section showed, the federal income tax of the richest has been small next to their gains. But when the slogan asks the rich to pay for what the state provides, the top 1 percent already pays a large share of the state’s income tax.
The share also swings, which matters for a budget. Top earners get more of their income than others do from stock sales and stock pay, so their taxes rise and fall with the market. The budget notes the top 1 percent’s tax bill fell 40 percent in 2022 “while the California economy remained fairly flat.”[8] That 40 percent is the drop in the dollars they paid. Their share of the tax fell from 50 percent to nearly 39.
A one-time tax on a few hundred people would bring in an amount that moves with stock prices. In the Legislative Analyst’s words, “much of the wealth is based on stock prices, which are always changing.”[2] The Analyst expects the tax to raise “tens of billions of dollars spread over several years.” That money comes once. Against it, the Analyst sees a possible loss that would keep going, less than $1 billion a year in income tax, if some billionaires leave or take other steps that cut their income taxes.[2] Even if the tax raised only $10 billion and the loss reached a full $1 billion a year, the one-time money would equal 10 years of that loss. After that, the loss would keep going.
The Analyst’s estimate counts only today’s billionaires. There’s a second risk it doesn’t try to price. Proposition 40 can’t reach anyone who moves to California later, or whose fortune crosses $1 billion later. It applies only to people who lived in California on January 1, 2026, and the change it makes to the state constitution covers only this one-time tax.[1] But founders and investors choose where to live by what they expect, not only by what the law says today. If they expect a state that has taxed wealth once to do it again, some may not come, and some on their way to $1 billion may leave before they get there. The official analysis has no estimate for that.
The top is also not a fixed group of people. That matters for a one-time tax, which reaches only those who are at the top, and living in California, on one date.
Economists Gerald Auten, Geoffrey Gee and Nicholas Turner used federal tax records to follow people who were in their late 30s in 1987. Picture 100 people in the top 1 percent of income that year. In 2007, about 23 of them were in the top 1 percent again. About 53 more had left it but were still in the top fifth. About 19 had moved down to a lower fifth. The last 5 or so had died, had no tax record or reported a loss in 2007. So more than three in four were still in the top fifth. Most stayed well off, just not at the very top.[9] That follows the same adults over 20 years. How children fare against their parents is a different question, which I took up in What a Fair Race Looks Like.
So the state’s General Fund, which pays for most public services, already leans heavily on its top earners. Their share rises and falls with the market, and, nationally at least, many of the people at the top change over time.
One payment doesn’t change what makes the bottom’s taxes heavy
The slogan asks billionaires to pay for the roads, schools and courts that helped make them rich. Most of the money wouldn’t go there. By the measure’s design, 90 percent of it would have to go to health care, and the rest to education, food aid and running the tax.[2] The measure’s own findings point to federal cuts to Medi-Cal, food aid and school funding.[1] So the money is aimed mostly at health care after those cuts. Only a small share could reach schools, and none would go to roads or courts.
A yes vote also settles the priority in advance. The state would decide when and how to spend the money, but only on those uses, and the constitutional rules that would normally send a share of new revenue to schools and community colleges wouldn’t apply.[2]
You might also expect money from the top to ease the tax bill at the bottom. Health care money can help the people who use that care, for as long as it lasts. It doesn’t change why the bottom’s tax bill is heavy.
As I found in California’s Tax Paradox, two things make it heavy. Sales and excise taxes take about 7.6 percent of the poorest fifth’s income, against 1 percent of income for the top 1 percent, and a property-tax line that includes an estimate of tax passed along in rent adds more.[4]
A one-time tax on the top changes neither of those. When the payments end, the bottom’s tax bill looks the way it does today. A credit that gave the poorest fifth back its sales taxes would change that every year, and by the math in that essay the credit would cost a small share of what those taxes raise.
Say it the long way
Here’s the slogan rewritten so every part of it is true.
Proposition 40 is a one-time tax of $50 million for every $1 billion of net worth, for fortunes of $1.1 billion or more, the same as California’s income tax on about $376 million of taxable income in a single year, though less than one average year’s growth in the wealth of the richest 0.1 percent of households. A few hundred people would pay it, usually by selling shares or borrowing against them, now or later, on a bill fixed by one day’s values even if those shares later fall. Much of a billionaire’s fortune is gains the income tax never reached, and the tax is expected to raise tens of billions of dollars over several years, most of it for health care, though the amount moves with stock prices. But it would land in a state whose top 1 percent paid 50 percent of its income tax in 2021 and nearly 39 percent in 2022, a share that swings with the market. It could also cost the state some income tax every year, less than $1 billion a year by the Analyst’s estimate, if some billionaires leave or cut their income taxes. It can’t tax anyone who arrives or crosses $1 billion later, but it may still shape whether they come or stay. And it would leave the taxes that weigh most on the poorest Californians where they are.
You can vote yes on that statement. You can vote no on it. That’s the statement worth voting on.
Reference Sources
- California Secretary of State. “Text of Proposed Laws: Proposition 40.” Official Voter Information Guide, California General Election, November 3, 2026. Accessed October 22, 2026. Revenue and Taxation Code sections 50301(a) to (c) (tax of 5 percent of net worth on individuals worth $1 billion or more, reduced by 0.1 percentage point for each $2 million of net worth below $1.1 billion, and five equal yearly installments, each later one subject to a 7.5 percent nondeductible deferral charge on the unpaid balance), 50303(c)(4) and (7) (real property held directly or through a revocable trust, qualified pensions and retirement arrangements excluded), 50304 (optional deferral accounts for taxpayers whose tax would exceed all their publicly traded assets, taxed at 5 percent of the fair market value of later distributions, under a contract that binds the taxpayer after leaving California and binds the estate), and 50308(n) and (o) (tax obligation date January 1, 2026, and valuation date December 31, 2026). Also section 2, findings (a) to (q) (federal funding cuts to Medi-Cal, food assistance and schools), and the new Article XIII, section 37(a) and (c) (the constitutional authority covers the one-time tax on residents as of the tax obligation date). The phase-in arithmetic is the author’s. At $1.0 billion, ($1.1 billion − $1.0 billion) ÷ $2 million × 0.1 = 5 points, so the rate is 0. At $1.1 billion and above it is 5 percent of the whole net worth. $2 billion × 5 percent = $100 million.
- California Legislative Analyst’s Office. “Proposition 40: Imposes One-Time Tax on Certain Taxpayers. Initiative Constitutional Amendment and Statute.” Official Voter Information Guide, California General Election, November 3, 2026 (official title and summary, and analysis by the Legislative Analyst). Accessed October 22, 2026. The one-time 5 percent tax on billionaires resident on January 1, 2026; the general exclusion of real estate, pensions and retirement accounts, “a few hundred people with net worth over $1 billion,” billionaires who “gained their wealth as executives or investors in California technology companies,” “much of the wealth is based on stock prices, which are always changing,” revenues of “tens of billions of dollars spread over several years,” that most of the money must be spent on health care (90 percent, the rest on education, food assistance and administration, with the state deciding when and how to spend it and the constitution’s school-funding and spending-limit rules not applying), and a possible ongoing decrease of less than $1 billion a year in state income tax revenue collected from billionaires.
- California Franchise Tax Board. “2025 Personal Income Tax Booklet.” FTB.ca.gov, Forms and Instructions 540. Accessed October 22, 2026. Schedule X (single filers): taxable income of $742,953 and over owes $72,219.84 plus 12.30 percent of the amount over $742,953. Behavioral Health Services Tax (formerly the Mental Health Services Tax): 1 percent of taxable income over $1,000,000. The author’s calculation, single filer, tax year 2025, before credits: 72,219.84 + 0.123 × (T − 742,953) + 0.01 × (T − 1,000,000) = 50,000,000 gives T = $376,159,123. Exhibit 1’s “about $376 million” is that figure.
- Institute on Taxation and Economic Policy. “Who Pays? California.” ITEP, 7th ed., 2024. Accessed October 22, 2026. For California under 2024 tax law at 2023 income levels, excluding senior taxpayers: personal income taxes of 8.8 percent of income for the top 1 percent, whose average income is $2,140,300, and sales and excise taxes of 7.6 percent of income for the lowest 20 percent and 1 percent for the top 1 percent. The rent estimate and the sales tax credit are discussed in the author’s California’s Tax Paradox.
- Board of Governors of the Federal Reserve System. “Distributional Financial Accounts Overview.” Federal Reserve, data through the second quarter of 2026. Accessed October 22, 2026. Data: the page’s “Raw Data: CSV (ZIP)” download (dfa.zip), file dfa-networth-levels.csv, with definitions in dfa-data-definitions.txt. Top 0.1 percent of households by wealth, 2026:Q2: corporate equities and mutual fund shares (excluding those held through defined contribution pensions) of 16,153,923 and unincorporated businesses of 4,780,991 against total assets of 28,168,034, or 57.3 and 17.0 percent, 74.3 percent together. For 1989:Q3, 305,337 and 586,073 of 1,802,492, or 16.9 and 32.5 percent, 49.5 percent together. Everything else is the remainder: 50.5 percent in 1989:Q3 and 25.7 percent in 2026:Q2. Shares are the author’s calculation from the published levels. Per the data definitions, unincorporated businesses include non-publicly traded businesses and real estate owned to rent out. Average yearly growth in the group’s net worth, before inflation, is the author’s calculation from the same file: (27,867,091 ÷ 6,758,223)^(1/20) − 1 = 7.34 percent from 2006:Q2 to 2026:Q2, and (27,867,091 ÷ 10,853,580)^(1/10) − 1 = 9.89 percent from 2016:Q2 to 2026:Q2. This is growth for the group as a whole. Its membership changes and it grows with the number of households, so it is not the growth of any one fortune.
- Eisinger, Jesse, Jeff Ernsthausen, and Paul Kiel. “The Secret IRS Files: Trove of Never-Before-Seen Records Reveal How the Wealthiest Avoid Income Tax.” ProPublica, June 8, 2021. Accessed October 22, 2026. The 25 richest Americans’ wealth rose $401 billion from 2014 to 2018, by Forbes’s estimates, while they paid $13.6 billion in federal income taxes, which ProPublica calls a “true tax rate” of 3.4 percent (taxes divided by wealth growth). Also the source of the two quoted lines. The article relays an estimate by Emmanuel Saez and Gabriel Zucman that $2.7 trillion of U.S. billionaires’ $4.25 trillion in wealth was unrealized gains. Their own note, “How to Get $1 Trillion from 1000 Billionaires: Tax their Gains Now” (April 14, 2021), assumes that about half of billionaire wealth in 2019 was unrealized gains. That estimate supports “much of” in the text and is not printed as a figure.
- Leiserson, Greg, and Danny Yagan. “What Is the Average Federal Individual Income Tax Rate on the Wealthiest Americans?” White House Council of Economic Advisers, September 23, 2021. Accessed October 22, 2026. An average federal individual income tax rate of 8.2 percent for the 400 wealthiest families over 2010 to 2018, with income defined as the change in wealth plus taxes, so that unrealized gains count as they accrue, with sensitivity analyses giving 6 to 12 percent.
- California Department of Finance. “Revenue Estimates.” Governor’s Budget Summary 2025-26. Accessed October 22, 2026. The top 1 percent’s share of resident personal income tax liability above 40 percent in 17 of 20 years through 2021, 50 percent in 2021 and nearly 39 percent in 2022 (over 170,000 returns); its tax liability down 40 percent in 2022 “while the California economy remained fairly flat”; and the personal income tax at over 67 percent of General Fund revenues before transfers in 2023-24, excluding pass-through entity elective tax credits. Exhibit 3’s shares come from California Franchise Tax Board, “B-3, Adjusted Gross Income with Accumulated Percentages.” California Open Data Portal, 2023 release, tax years 2000 to 2022, resident returns by income class. The percentile shares are the author’s estimates by interpolation within the Board’s income classes, and this budget document corroborates only the top 1 percent.
- Auten, Gerald, Geoffrey Gee, and Nicholas Turner. “Income Inequality, Mobility, and Turnover at the Top in the US, 1987-2010.” American Economic Review, vol. 103, no. 3, May 2013, pp. 168-72 (Papers and Proceedings, linked here in its conference version). Accessed October 22, 2026. Table 1: of taxpayers aged 35 to 38 in 1987 who were in the top 1 percent that year, 23.31 percent were in the top 1 percent in 2007 and 76.60 percent were in the highest quintile. Of the rest, 4.68, 3.34, 3.72 and 6.94 percent were in the lower four quintiles (18.68 in all), 2.71 percent had died, 0.59 percent had no tax record and 1.41 percent had negative income (4.71 in all). The table’s rows sum to 100. The per-100 walk in the text is the author’s rounding: 23, 76.60 − 23.31 = 53.29, about 53, 18.68, about 19, and 4.71, about 5. The table’s 1987 centiles are set among all taxpayers aged 25 to 65 and its 2007 centiles among taxpayers aged 55 to 60. The authors conclude that many high-income earners “remain high earning in later years.”