I was watching a recording of a Stanford talk by the economist Raj Chetty when the chart came up again. You have probably seen it. It comes from a 2017 paper called “The Fading American Dream.” A single line falls from the upper left to the lower right.
Among children born in 1940, 92 percent grew up to earn more than their parents. Among children born in the mid-1980s, the number is 50 percent.[1]
The American Dream, reduced to a coin flip.
My first reaction was the one the chart invites. Out-earning your parents used to be close to guaranteed. Now it barely happens. The country broke something.
Then I looked at the chart again, and two details stopped me.
The first is the y-axis. It starts at 50, not zero. The visual fall spans nearly the full height of the frame, so your eye reads something close to total collapse.
The actual decline is from 92 to 50. Still enormous. But the chart roughly doubles the feeling of it. Chart makers zoom axes to show detail all the time, and the paper prints the plain numbers up front. Yet a chart travels farther than its paper, and this one travels with its frame.
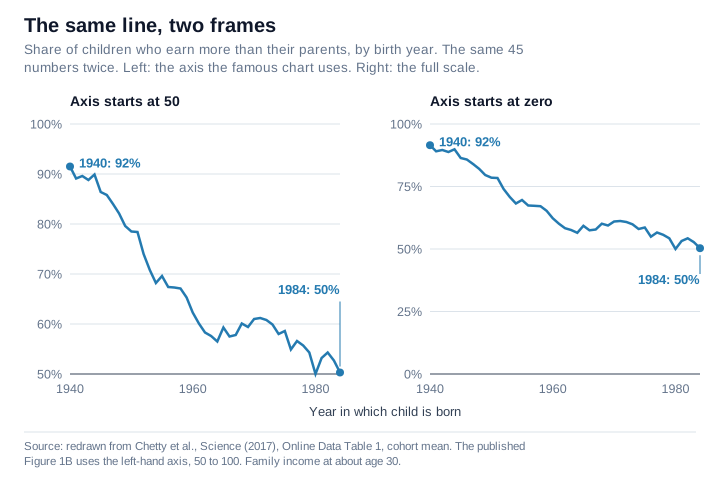
The second detail took longer to see. The x-axis starts at 1940. The chart opens at its own peak. It shows you the fall but never the approach.
And your brain, mine included, quietly fills in the missing history: a flat line at 90 percent stretching back through the generations, the natural order of American life until something recent ruined it.
I doubted that flat line. Farm families in the 1880s. Immigrants in tenements in 1905. The Depression. Many of their children did climb, and those climbs are the country’s best-known stories. But a country with those hard starts does not look like one where out-earning your parents was settled, flat and guaranteed, generation after generation.
So I went looking for the left half of the chart.
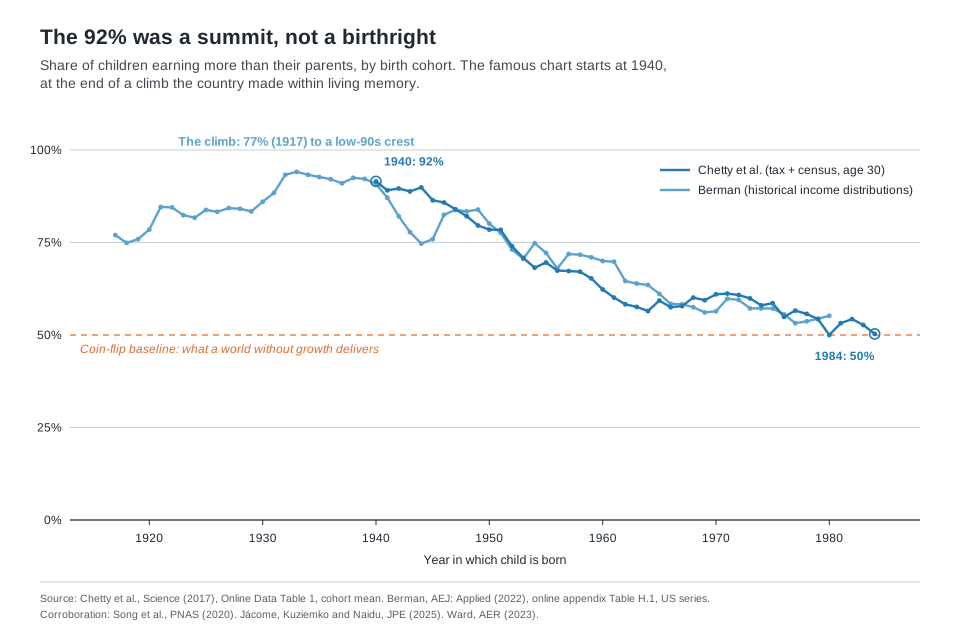
Here is what I found: the flat line is nowhere in the record. The 92 percent was a summit America climbed within living memory, not a birthright it lost.
And once you see the climb, the story changes from mourning a golden age to something far more useful, because a climb has causes, and causes can be studied, and some of them a country can shape again.
The missing left half shows a climb
The reason the chart starts at 1940 is honest enough. Chetty’s team combined census and survey snapshots with tax records for recent generations. Children born in 1940 are as far back as that method reaches, because the census first asked about income in 1940.[1]
Use a lower estimate of inflation and the 1984 number is 59 percent, not 50. Compare only sons with their fathers and it is 41.[1] The fall survives those tests. The exact number does not.
Other researchers have carried the picture back before 1940, using different data and different methods, and none of them found that flat 90 percent line stretching back through the generations.
The economist Yonatan Berman rebuilt the same out-earn-your-parents number for earlier generations. He combined old records of how much people earned and how that income was spread, and the American Economic Journal published the study in 2022. His United States series starts with children born in 1917. Their number was not 92 percent. It was 77 percent.[2]
The line jumps in the early 1920s and holds in the low-to-mid 80s for the rest of that decade. Then it climbs again, to a crest above 90 percent for children born between 1932 and 1940, highest in 1933.[2] Then it turns down. The war years put a dip in the series for a few cohorts, and from there his line and Chetty’s walk down together.
In Berman’s own summary, the out-earning rate in the United States rose for children born from the 1910s to the 1940s, was already high before the war, and peaked in the 1930s. The summit ran right up to where Chetty’s chart begins. And even the low end of that climb, three children in four, would look like a triumph today.
Go further back and the yardstick changes from income to jobs. Xi Song and colleagues linked census records from 1850 forward and measured mobility through occupations rather than income, for white men born in the United States. Their headline finding is a long decline in mobility. Sons’ jobs came to track their fathers’ jobs more closely, mostly among sons born before 1900, as farm children moved into industrial work.[3]
But look only at sons whose fathers did not farm. The share who moved up the job ladder rose for sons born before 1900. It changed little for the next few decades. Then it fell for sons born after 1940.[3] A different measure, and again a record that climbs before it falls.
A third team asked a different question: who gets counted? Older studies had tracked mostly white men. Elisa Jácome, Ilyana Kuziemko, and Suresh Naidu built what they describe as the first mobility estimates that represent everyone born in the United States, women and Black Americans included.
Their finding: relative mobility rose sharply from the 1910s cohorts to the 1940s cohorts.[4] In plain terms, where your parents stood said less and less about where you would end up.
And about half of the rise came with one change, the narrowing of income gaps between Black and white families.[4] Leaving Black Americans out, the older approach, had made mobility look higher than it was and its rise look smaller.
Mobility did not fade from some universal golden age. It grew, for a while, as more of the country shared in it.
And the deeper past? Zachary Ward went back through the linked census data from 1850 to 1940 and corrected two flaws. Older work left out Black families. It also leaned on records noisy enough to make fathers and sons look less alike than they were. Fix both, and a child’s place can look about twice as tied to the parents’ place.[5]
His conclusion is worth quoting: “there is greater equality of opportunity today than in the past, mostly because opportunity was never that equal.”[5]
Four research teams. Four different yardsticks, only one of them the chart’s own. And the past the chart lets you imagine, a permanent plateau of 90 percent, appears in none of them.
The baseline is a coin flip
The chart holds back one more thing, and it explains why the axis choice matters so much. What should this number be? What is the baseline?
Think about what the statistic measures. Three things decide whether a child out-earns their parents. How much the economy grows. How the gains get spread. And where the child lands compared to where the parents stood.
Now remove the growth. In an economy where average incomes stay flat generation after generation, out-earning your parents becomes a lottery of positions. Some children land higher than their parents ranked. Some land lower. The share who come out ahead hovers near half.
That shuffle is not a thought experiment. In What a Fair Race Looks Like, I read the full table behind a debate chart, for about 21 million children born from 1978 to 1983. By their mid-thirties, about one child in three had landed in a higher fifth of the income ladder than their parents, and about one in three in a lower fifth.[6]
Six in ten born into the top fifth had left it, and two in three born into the bottom fifth had moved up.[6]
Children lose ground while others gain ground. A rank has only so many places, so one child’s gain is another’s loss.
Those figures are averages. The researchers behind that table find Black Americans and American Indians have much lower rates of upward mobility and higher rates of downward mobility than white Americans.[6]
Fifty percent is not the bottom of this statistic. It is the resting state of a world without growth.
And a world without growth describes most of human history. For centuries before the industrial era, living standards barely moved from one generation to the next.[7] The North Sea economies of Europe grew while most of the pre-industrial world stood still. Even they took from 1347 to 1820 to triple their income per person, about 6 to 7 percent per generation.[7]
The honest long-run baseline for this number sits near the very line where Chetty’s chart cuts off its axis. By that logic, the chart starts where history spent most of its time.
That reframes both ends of the line. The 92 percent stops looking like a birthright and starts looking like what it was: a historic rise in living standards that reached most people.
That rise landed on children whose parents’ incomes the Depression had flattened. Those children entered the postwar boom, and nearly all of them cleared a bar their parents’ generation had set painfully low. The conditions were real, and they were not normal.
Both readings are true, and the difference decides what you do
At this point you might expect the comforting conclusion. The peak was an anomaly, the 50 percent is a return to normal, relax. That conclusion is wrong, and it matters to see why.
A coin flip is the baseline for an economy without growth. The United States is not an economy without growth. The economy’s output per working-age family, after inflation, kept growing through the decades Chetty’s chart covers, just more slowly than before.[1]
In a growing economy, a 50 percent rate does not say the lottery is running as expected. It says too little of the growth is reaching the typical child.
It does not say children stopped moving. Chetty’s paper says so directly: the out-earning rate has fallen “while relative mobility has remained stable,” because income growth stalled across much of the income distribution.[1] In plain terms, for children born since 1971, the years tax records can check, the odds of passing and falling have held about steady. What changed is what losing your place costs.
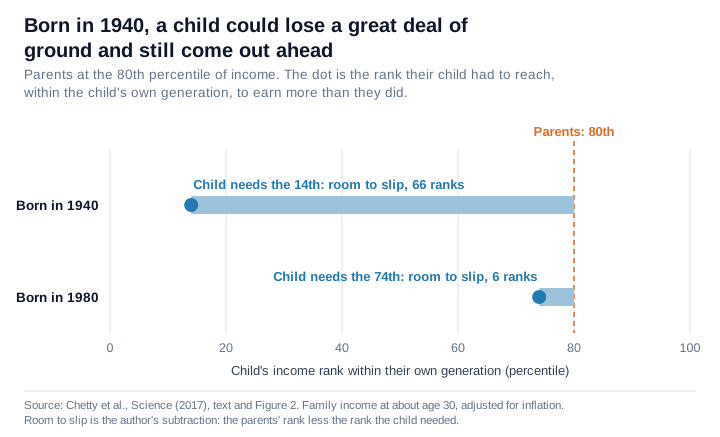
Take parents who earned more than 80 percent of other parents. Among children born in 1940, their child could land near the bottom, at the 14th percentile of their own generation, and still earn more than they did. Among children born in 1980, that child had to reach the 74th.[1]
A child born in 1940 could lose a great deal of ground and still come out ahead, because the whole economy was rising under them. Now, losing your place usually means earning less than your parents did.
The 50 is also a blend, and the blend shows where the failure sits. Children of the poorest families still mostly clear the bar. Children of high earners mostly don’t, though their parents set a very high bar to beat. The middle is the worry: at the median, the share is now a little under half.[1]
Where the fall came from depends on where you look. Chetty’s team ran what-if scenarios. How the gains get spread, they concluded, matters more than how fast they come. Give today’s economy the more equal sharing that children born in 1940 saw, and the out-earning rate recovers most of the lost ground.[1]
Berman looked across ten countries. In most of them, slowing growth was the main force. But the United States is one of the exceptions, where unequal sharing, not slower growth, drives the fall.[2] So for America, both studies point to the same lever, how the gains get spread. And neither disputes the shape of the mountain.
So both readings of the chart are true at once. The summit was anomalous, and the present is still a failure.
Holding both thoughts changes the goal. If you believe the flat-plateau story, the project is restoration: get back to the way things always were. The natural instinct is nostalgia for the 1950s.
If you see the climb, the project is engineering: work out which parts of the climb a country can choose. The climb had identifiable drivers. Berman traces it mainly to fast income growth. And about half of the measured rise in relative mobility came with the narrowing of income gaps between Black and white families. Both can be studied, and neither is finished.
The chart is a fine piece of evidence. What misleads is the way it travels.
Watch the axes. The y-axis starts at 50, so a coin flip sits at the floor of the frame and looks like zero. A coin flip is the baseline, and the baseline tells you what the number means. The x-axis starts at 1940, so it leaves out the climb, and the climb tells you the peak had causes. It was not a birthright.
I keep coming back to what that means for a family looking at their own children. The message for them was never that out-earning your parents is guaranteed, and it is not that the dream is dead.
Children will pass one another and fall behind one another in any generation. Conditions shape how much of that movement there is, and what falling behind costs.
Some of those conditions no one would want back: part of the 92 percent came from the low bar the Depression left. Others a country can shape. Jácome, Kuziemko, and Naidu read the twentieth century as evidence that policy and institutions can loosen the tie between where you start and where you end up.[4] Those conditions existed within the lifetime of people still with us, and a country that shaped them once can decide to shape them again.
Reference Sources
- Chetty, Raj, David Grusky, Maximilian Hell, Nathaniel Hendren, Robert Manduca, and Jimmy Narang. “The Fading American Dream: Trends in Absolute Income Mobility Since 1940.” Science, 2017, www.science.org/doi/10.1126/science.aal4617. Series values from Online Data Table 1 (cohort mean), https://opportunityinsights.org/wp-content/uploads/2018/04/table1_national_absmob_by_cohort_parpctile.xlsx. Accessed July 22, 2026. Working-paper version: NBER Working Paper 22910, December 2016, https://opportunityinsights.org/wp-content/uploads/2018/03/abs_mobility_paper.pdf. Accessed September 29, 2026. The sample, the income definition, the 59 percent (inflation rate lowered by 0.8 percentage points a year) and the sons-against-fathers 41 percent are from the Science paper’s methods and sensitivity sections. It reports that ranks were about stable for the 1971 to 1984 birth cohorts. The 14th and 74th percentile examples are its discussion of Figure 2. Immigrants are excluded from the 1964 birth cohort on, because the survey did not ask birthplace before 1994 (working paper, footnote 7). The paper finds the 1940 cohort’s high rate holds under any plausible pattern of ranks. Room to slip in the chart is the author’s subtraction: the parents’ rank less the rank the child needed. Parent-income rates are from Online Data Table 1, downloaded November 3, 2026, children born in 1980: 69.9 percent at the 10th percentile of parent income, 45.2 at the 50th, 32.9 at the 90th, parents with positive income. At the 50th percentile, children born 1980 to 1984: 45.2, 48.0, 51.6, 48.4, 46.1, average 47.9.
- Berman, Yonatan. “The Long-Run Evolution of Absolute Intergenerational Mobility.” American Economic Journal: Applied Economics, 2022, www.aeaweb.org/articles?id=10.1257/app.20200631. United States series values from the study’s online appendix, Table H.1, www.aeaweb.org/articles/materials/16942. Accessed July 22, 2026.
- Song, Xi, Catherine G. Massey, Karen A. Rolf, Joseph P. Ferrie, Jonathan L. Rothbaum, and Yu Xie. “Long-Term Decline in Intergenerational Mobility in the United States Since the 1850s.” Proceedings of the National Academy of Sciences, 2020, www.pnas.org/doi/10.1073/pnas.1905094116. Accessed July 22, 2026.
- Jácome, Elisa, Ilyana Kuziemko, and Suresh Naidu. “Mobility for All: Representative Intergenerational Mobility Estimates over the Twentieth Century.” Journal of Political Economy, 2025, www.journals.uchicago.edu/doi/10.1086/732527. Accessed July 22, 2026.
- Ward, Zachary. “Intergenerational Mobility in American History: Accounting for Race and Measurement Error.” American Economic Review, 2023, www.aeaweb.org/articles?id=10.1257/aer.20200292. Accessed July 22, 2026.
- Chetty, Raj, Nathaniel Hendren, Maggie R. Jones, and Sonya R. Porter. “Race and Economic Opportunity in the United States: An Intergenerational Perspective.” Quarterly Journal of Economics, 2020, https://opportunityinsights.org/wp-content/uploads/2018/04/race_paper.pdf. Online Data Table 2, row “All, P,” https://opportunityinsights.org/wp-content/uploads/2018/09/table_2-3.csv. Accessed November 3, 2026. All children born 1978 to 1983, 21.3 million. Children’s household income at ages 31 to 37, parents’ household income when the children were 11 to 22, each ranked into five equal groups. Author’s sums from the table: 36.0 percent landed in a higher fifth than their parents, 34.8 in a lower fifth, 29.2 in the same fifth. 60.6 percent of children born into the top fifth left it, and 66.3 percent born into the bottom fifth moved up.
- Bolt, Jutta, and Jan Luiten van Zanden. “Maddison-Style Estimates of the Evolution of the World Economy: A New 2023 Update.” Journal of Economic Surveys, 2024, doi.org/10.1111/joes.12618. Accessed July 22, 2026. Per-generation figure is the author’s arithmetic, at 25 to 30 years a generation.