Imagine I offered you a wager.
Put up $180,000.[1] You may borrow part of it, on a loan that bankruptcy erases only for undue hardship. In exchange you get a ticket. If the ticket wins, you earn a solid return, somewhere around 12.5 percent a year, better than the stock market. If it loses, you can be out much of that stake, with little to show for it but the debt.
Here is the catch. The 12.5 percent is the number they print on the wall. It does not show your odds of winning. And your odds depend almost entirely on which ticket you are holding.
That is the wager 18-year-olds make every fall. They are shown the winner’s payout and told college is worth it. It is not a sure thing, and it is not a single thing. Some tickets in this game are among the best bets you can make anywhere. Others lose more often than they win. The trouble is that everyone is handed the same number, the winner’s number, no matter which ticket they hold.
Let me show you how to read your own.
The number on the wall is the winner’s payout
Two New York Fed economists, Jaison Abel and Richard Deitz, published an analysis in 2025 putting the return on a college degree at about 12.5 percent a year, and noted it beats stocks and bonds.[1] That number gets quoted as proof that college pays.
Read what it actually measures. The 12.5 percent is the median for the people who finish. It is not even the prize for a clean win. It blends the graduates in degree-level jobs with the ones working jobs that typically do not require the diploma. Then it drops everyone who starts college and does not finish.
That is the first thing the number hides. It is a median of survivors.
The typical number is a disguise
Here is the move the famous number pulls. It takes a group that runs from likely loss to one of the best investments on earth, folds it into a single figure, and hands that figure to everyone.
Take a well-prepared student in a high-demand major, at a school where almost everyone finishes, paying a low net price. Her odds and her payoff blow the typical number away. It is not close.
Now take a student in an oversupplied field, paying full sticker price on borrowed money, at a school where barely half finish. His odds and his payoff fall far below that number. For him, the same degree is a likely loss.
Those two sit on opposite ends of the board. The single number sits between them and describes neither. The Fed’s own authors say the figure applies to graduates, and a second post of theirs finds a degree may not pay for at least a quarter of them.[1] But when the 12.5 percent travels, the 18-year-old holding a great hand and the one holding a terrible hand hear the same number, and both hear it called a sound investment.
That is the real sleight of hand. Not that college never pays. That the winner’s number gets sold to everyone, including the millions whose true odds are nothing like it.
So count your own odds
Start with two published facts.
About 39 percent of students who start do not finish within six years, according to the National Student Clearinghouse.[2] Most leave with lost time and no degree, and many with debt. So six in ten finish.
Among all college graduates, about a third are underemployed at any given time, by the New York Fed’s count, working jobs that typically do not require the degree.[3] So about two-thirds are in the kind of work the degree was supposed to buy.
Put those together for the average student and the chance of both finishing within six years and being in degree-level work at a given time is roughly 61 percent times 67 percent, about 41 percent. Two in five. The two rates come from different groups, since the completion rate counts any credential, from a certificate to a bachelor’s degree, and the underemployment rate counts people with a bachelor’s degree or more, so treat 41 percent as a rough estimate.
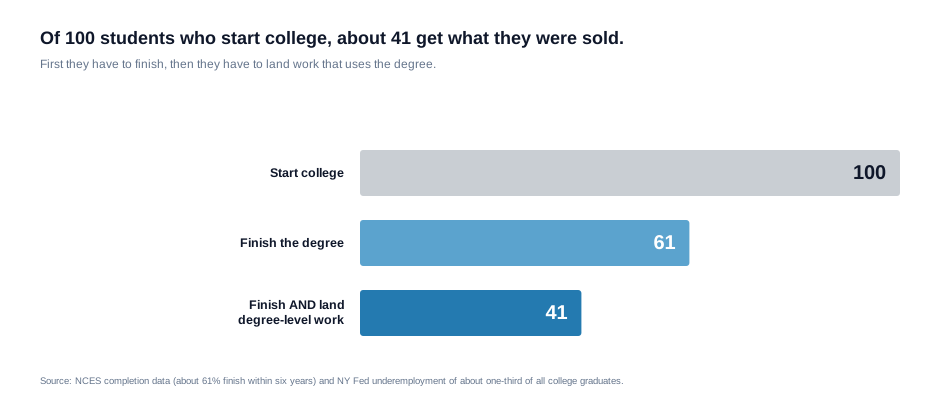
But 41 percent is the average player’s number, and you are not the average player. Run the same two questions for your actual case. What share of students finish at the school you are looking at? What do graduates of your specific major really earn, and how many of them work in the field? Most of those numbers exist, and they swing the odds hard in both directions. A strong program at a school where nearly everyone finishes is a different bet entirely from an open-enrollment school where half drop out. The average buries that difference. Your job is to dig it back up.
What the average bet looks like, and why no one holds it
Count everyone who starts, including the ones who leave and the ones who take five or six years to finish, and the pooled return falls to about 10 to 10.5 percent.[4] That sounds like a small change, and it hides the real one. A rate of return can be positive and still fall short of the 7.8 percent my model uses as the bar the money has to beat, so a student who leaves after two years can post a positive rate and still end up about $31,000 behind someone who went straight to work, counted at that 7.8 percent bar. And the 12.5 percent headline sits at or above the 65th to 70th percentile of everyone who enrolls, so roughly two in three students who start do worse than the number on the wall.
That is a lot of risk on a large stake, and part of it may be borrowed, on a loan that bankruptcy erases only for undue hardship.
But it is not one product. The pooled figure is a blend of the same wild range, the likely losses dragging down the genuine winners. No real student faces the average. Every real student faces their own odds. Those odds run from terrible to excellent. A handful of things they can actually look up decide where they land.
How to read your hand
None of this means college is a scam, and the money math is not the whole of the value. A degree carries things a return cannot capture, and early underemployment often fades with time. Hold all of that.
But the money is what families borrow against, and on that ground the rule is simple. Stop reading the number on the wall. Read your own ticket. Look at your specific major and school. Find what its graduates actually earn and how many of its students finish. Compare that to the price you will really pay, not the sticker, and to the plain alternative of going straight to work. The famous number was never going to tell you whether to take the bet. It cannot. It is describing a thousand other people at once. Only your own numbers describe you.
You can run yours in a few minutes at collegeroi.org.[5] If you want to see exactly how the famous returns get inflated, I take the major studies apart in a companion piece, Auditing the Numbers That Say College Pays. The loan behind the bet, the part that follows you if the ticket loses, is the subject of a coming piece, Two Kinds of Debt. And I first laid out the idea that a degree is a bet whose odds most families never see in Warning: This Degree Could Be Hazardous to Your Wealth. This piece hands you the odds.
Sources and references
- Abel, Jaison R., and Richard Deitz. “Is College Still Worth It?” Liberty Street Economics, Federal Reserve Bank of New York, 16 Apr. 2025. Accessed June 15, 2026. The 12.5 percent return for the median graduate. The post also puts the average total cost of a four-year degree in 2024 at about $180,000, counting tuition, fees, books and supplies after grant aid plus the wages a student gives up while in school. It also says the authors’ second post finds a college degree “might not be worth it for at least a quarter of college graduates.”
- National Student Clearinghouse Research Center. “Yearly Progress and Completion.” National Student Clearinghouse Research Center, 4 Dec. 2025. Accessed September 24, 2026. About 61 percent (61.1 percent for the fall 2019 cohort) of first-time students at two-year or four-year schools finish a credential within six years, counting those who transfer and finish elsewhere, so roughly 39 percent have not finished by then. About 9 percent of the cohort is still enrolled. Graduation rates that count only students who finish at the school where they started leave those transfer completers out.
- Federal Reserve Bank of New York. “The Labor Market for Recent College Graduates.” Federal Reserve Bank of New York, 2026. Accessed September 24, 2026. Underemployment of about 42 percent for recent graduates and about 34 percent for all college graduates in June 2026, the latest month, as monthly shares in the Fed’s data workbook. The same page notes that many underemployed graduates “transition into better roles after gaining some work experience.”
- Author’s enrollee-weighted calculation (August 19, 2026), replicating the Fed’s framework and counting students who leave after two years and graduates who take five or six years: pooled return about 10 to 10.5 percent, a two-year leaver about $31,000 behind at a 7.8 percent discount rate, and the 12.5 percent headline at or above the 65th to 70th percentile of enrollees. It replaces a rougher 7.6 percent estimate used in an earlier version of the author’s essay Degrees of Assumption.
- Institution-level and program-level returns are from the author’s own model. Run any school and major at https://collegeroi.org.