I have written twice now about the University of Michigan’s decision to take first-semester letter grades off the transcript. Once about the policy itself, and once about why the arguments against it, mine included, mostly go unread. This is the third piece, and it is about something I have been circling the whole time.
How do capable people, running one of the best universities in the country, look at a problem and reach for the wrong lever?
I want to be careful with that question, because the internet’s answer was that they are fools, and they are not. So before I say anything critical, here is what they built.
What they built
Take the more than sixteen hundred four-year colleges the federal data scores, and line them up by what the typical graduate earns four years after finishing. Michigan sits sixty-ninth. Its median graduate earns about $96,000, which puts it inside the top five percent of American four-year colleges.[1]
Line them up by how many students finish. More than ninety-three of every hundred students who enroll at Michigan go on to finish, twenty-sixth of them by that measure.[1]
Now look at what an in-state family actually pays after aid. Michigan’s average net price for in-state students is about $13,000 a year. Of the eight Ivy League schools, only Princeton is cheaper.[1] Michigan does this while enrolling about thirty-four thousand undergraduates, four and a half times the size of a typical Ivy.[1]
So a public university that outearns Brown, graduates students at an Ivy rate, and charges in-state families less than seven of the eight Ivies, at four and a half times their scale.
I do not know a better description of an institution that works. The people who run it are not guessing. They have been getting the big things right for a very long time.
Which is exactly why the grading decision is worth thinking about. When people this capable reach for a lever this small, the interesting question is not what they got wrong. It is what they were looking at when they decided.
The number they were looking at
Here is what I think they saw. A university with a $96,000 median, a ninety-three percent graduation rate, and a student body under visible strain. If those first two numbers are the health of the institution, then the strain cannot be coming from the institution. It has to be coming from somewhere else.
Pressure. Grades. The transition to college. Cover the grades for a semester and let them breathe. I have written elsewhere about how grade inflation concentrated that pressure rather than relieving it, and I will not repeat it here.[2]
That reasoning is sound if the $96,000 is the right number to be looking at. It is not, and the reason is not that it is wrong. It is that it is a median of things that should not be pooled.
I pointed at this fork at the end of the first piece and moved past it. It deserves the whole section, because it is exactly what the median hides.
Michigan teaches economics and it teaches rhetoric and writing. Its economics majors earn about $110,000 four years after graduation, with statistics and mathematics inside fifteen hundred dollars of that. Its rhetoric and writing majors earn about $44,000.[3] Same campus, same diploma. Two and a half times apart.
Borrowing barely varies from program to program. Across all fifty-nine of Michigan’s scored bachelor’s programs, the middle half of them sit inside a sixteen percent band, roughly $16,800 to $19,500.[3] The full range, from the program where students borrow least to the one where they borrow most, is less than double.
So a student who borrowed about the same as everyone else walks out into a range of outcomes that runs nearly fourfold across the university.
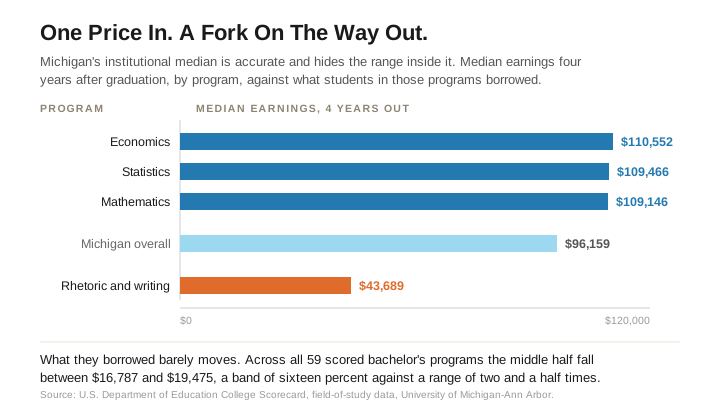
That is the fork. Nearly the same price in, wildly different result out. And it sits in the same federal data as the $96,000.
The $96,000 is what that data says when you read it at the level of the whole university. The fork is what it says when you read it at the level of the programs.
Someone will say a spread like that is normal. Of course economics pays more than writing, and that is true nearly everywhere. Which is right, and it is why the flat price is the strange part.
Normally a price tells you something about what you are getting. Here it tells you almost nothing. Similar borrowing carries one student into the top of that range and another into the bottom, and nothing in the transaction signals which.
And no version of the credential fixes this. The fork is this wide at a university in the top five percent of the country. Pay in a field is set by the demand for the work and the supply of people trained to do it, and a diploma does not override that arithmetic, Michigan’s or Harvard’s. What a school controls is not what the market pays its rhetoric graduates. It is whether anyone shows the student that number before she signs.
I want to be exact about the claim. The median is not incorrect. Michigan really is a $96,000 university. But a single figure that pools a $110,000 outcome and a $44,000 outcome is not a fact about either student. It is a fact about the university, and the university is not the one who borrowed the money.
These are earnings and not returns, since neither figure subtracts what the degree cost or the years spent earning nothing. What matters here is the distance between them, not where either one sits. Read the whole and you will miss the parts, and I think the parts are where the distress lives.
I have watched this exact mistake before
I spent several years and five hundred pages on a question that turned out to have the same shape.
For two decades, the research on whether college pays for itself reported that it did, handsomely, on average. The number was real. In most of the studies I read, it was also an average of graduates, not of dropouts, so the students who paid and never finished were not in it, and it was gross, so the taxes that come out of a higher salary were not in it. It counted the earnings and not always the four years of earnings a student gave up to be in class.[4]
Each omission was individually defensible. Together they produced a number that looked complete and answered a different question from the one a family was asking.
Nobody doing that research was a fool either. They were competent people handed an instrument that summarized well and hid the distribution.
When I finally ran the institutions themselves through a model that put the omissions back, the median stopped beating the high school path, at full price and at the net price families actually pay. About a third of programs stayed behind it even if you set the price at zero.[4] The average had not lied. It had aggregated the failures into the successes until they disappeared.
That is what I think happened at Michigan, one room over. An administrator is handed the university’s numbers. They are good. They are true. And they are summarized at the one level where a $44,000 program and a $110,000 program produce a single reassuring figure.
Nothing in that figure says look lower. So nobody does. And when distress shows up anyway, the easiest place left to look for it is in the students themselves.
There is one difference between the two cases, and it does not run the way you would expect. The researchers were mostly outsiders, working from national surveys and public data files. Michigan is reading about itself. It has the program-level numbers, the enrollment records, and the students in the building. Better access, same blind spot, which tells you access was never what was missing.
The problem arrives with no owner
There is one more piece, and it explains why the fork stays invisible even to people who could find it in an afternoon.
A student in a $44,000 program borrowed about $14,000 to get there. The student in the $110,000 program next door borrowed about $19,000. Five thousand dollars of difference, for an outcome two and a half times apart.
The student in the $44,000 program does not know that. Nobody has shown her. She is not comparing projected earnings across majors in week eleven. In my experience, almost nobody is. What she has is hard coursework and no way to test whether the deal she signed was a good one. My guess is that some of that uncertainty walks into student services, or the counseling center, or a dean’s office, and it walks in as distress. So it gets treated as distress. That is not negligence. That is what the office is for.
What I cannot find is anyone routing it back to where it started. The composite question, whether the students in a given program are borrowing about as much as everyone else and getting less for it, belongs to nobody in particular. Institutional research can run it. Nothing I can find routes a distressed student in October back to it. Enrollment recruits. Advising advises. Financial aid checks eligibility. Each is competent inside its own frame, and the fork falls between all of them.
A problem that belongs to nobody gets solved by whoever it happens to land on, with whatever lever that office has. The college has a grades lever. So the grades will be covered.
It does not have to go that way, and I have already written about the place where it did not. A working group of faculty and administrators at UC San Diego found students arriving unprepared in mathematics, measured it, published it, and corrected an error in their own figure on the record.[5]
What I did not say then is what they did next. They recommended a tool to match incoming students to programs they were prepared for, and placement testing early enough to matter. Nobody covered anything. They read the file at the level where the problem showed and then owned it.
That is the whole difference. It is a difference in which number somebody decided to look at, and whether anyone was standing where the answer would land.
What I would ask
I said at the start that the people who built Michigan are not fools, and I meant it. So the ask is that they open a different page of a file they already have.
Which of your programs leave the median graduate earning less than they would have without the degree, once you count what they borrowed and the years they gave up? How does the borrowing in those programs compare to the borrowing in the ones that pay? And when a student in one of them arrives at counseling in October, does anyone in the room know which program she is in?
None of that requires covering a grade. It requires reading the parts. It is the same thing I would ask of anyone holding a summary number that says they are fine, including the version of me that started this work assuming the premium answered the question.
That is the reason I keep coming back to this one university. Not because they got it wrong, but because if people this good can miss it, then the instrument is the problem, and the instrument can be fixed.
Reference Sources
- Author’s model over U.S. Department of Education College Scorecard data (March 2026 release), 1,679 four-year institutions. Accessed August 12, 2026. University of Michigan-Ann Arbor: median earnings four years after graduation $96,159, rank 69 of 1,679. Completion rate 93.66 percent, rank 26 of 1,657. Average net price $13,138 (in-state students only, as the Scorecard reports it for every public university). Undergraduate enrollment 34,177. Ivy League comparison on the same fields, where Princeton is the only Ivy with a lower average net price. Enrollment ratio computed against the median Ivy.
- Shivamber, Leon. “The Measure They Kept.” shivamber.com, August 2026. Companion essay on the Michigan policy and the grade-inflation mechanism behind it.
- U.S. Department of Education College Scorecard, field-of-study data (March 2026 release), University of Michigan-Ann Arbor bachelor’s programs. Accessed August 12, 2026. Median earnings four years after graduation and median federal loan debt (Stafford and Grad PLUS) of program completers who took federal loans, as defined in the Scorecard field-of-study documentation. Fifty-nine programs with reported debt. The interquartile range is $16,787 to $19,475 and the full range $13,720 to $23,150. Economics $110,552, statistics $109,466, mathematics $109,146, rhetoric and composition $43,689. Median earnings across the programs run from $43,689 (rhetoric and composition) to $172,904 (computer and information sciences). Michigan sets undergraduate tuition by school, residency and class level, with one exception by major (2026-27 tuition schedule). In the College of Literature, Science, and the Arts every major pays the same rate except computer science, which costs more in the upper-division years. The engineering and business schools charge more than that college in every year. The debt figures are federal loans only.
- Shivamber, Leon. We Need To Talk About Higher Education. On the omissions in the college-premium literature and their combined effect on the median return. Two studies show how the research differs. Jaison R. Abel and Richard Deitz, “Is College Still Worth It?” Liberty Street Economics, Federal Reserve Bank of New York, April 16, 2025, estimates the return for college graduates and counts four years of forgone earnings as a cost. Anthony P. Carnevale, Ban Cheah and Martin Van Der Werf, A First Try at ROI: Ranking 4,500 Colleges, Georgetown University Center on Education and the Workforce, 2019, uses Scorecard earnings that include non-completers and does not deduct forgone earnings. Both accessed September 25, 2026.
- Senate-Administration Working Group on Admissions, University of California San Diego. “Final Report.” November 6, 2025. Accessed August 12, 2026. The report names four coinciding causes, corrects an earlier one-in-eight figure to one-in-twelve, and recommends a Math Index for matching students to majors and early placement testing.