Defeating racism, tribalism, intolerance and all forms of discrimination will liberate us all, victim and perpetrator alike.
Ban Ki-moon
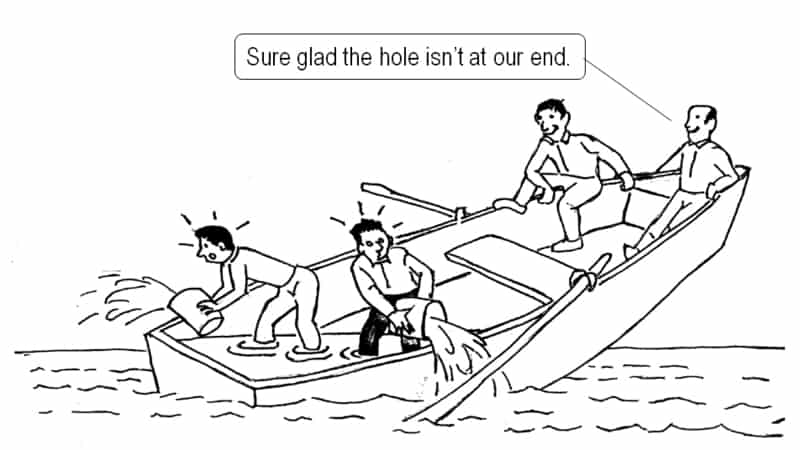
You are probably not going to like this.
But you will be surprised and you will learn something new.
- There is Racism in America, and it seems to be getting worse.
- Let’s start in Minneapolis.
- Why is this important for all of us?
- A call to action
- It’s time to step back and think this through.
- The facts?
- A word about the data and the visualizations shown here.
- Police Killings In The USA
- Are police killings a sign of institutional violence?
- When will we know racism in America is no longer?
- Inter-race violence is not the norm.
- Are police disproportionately killing blacks?
- Where is the police violence problem?
- The hypocrisy of the pundits.
- So what should we do?
- Sources and references:
- Bad Science or deliberate manipulation?
- Examples of dishonest visualizations and proper visualizations
- Other charts not used in the discussion above, but relevant to the debate
Before we dig into the details, even though there’s a risk of losing some of you, let me make this observation:
There is Racism in America, and it seems to be getting worse.
Why do I say so?
Simple.
There are two opposing primary views on what is happening across America today.
On the one side are those who point to George Floyd and see institutionalized racist violence.
On the other side are those who think random violence is framed with a racist lens (reverse racism).
If either side is correct, then there is racism.
If either side is partly correct, then there is racism.
Ergo, there is racism.
And it’s getting worse.
It’s worse because the scope, frequency, and effects of the debate and subsequent actions are growing consequentially.
That’s not saying that we have not made progress on racism in this country.
The opposite is true.
But you can’t just sit in your living room and think to yourself that thankfully “I’m not racist.”
Nor can you simply say that the people you know are not racist.
Not when others are screaming at you that they experience prejudice every day and that you are racist.
Moreover, making progress does not mean we can’t continue to improve.
Instead, I am saying that we still have racism.
Whether we like it or not, this actual or implied racism affects us all.
We must do something about it.
What we do about it depends on what we know about it.
But I am jumping ahead of the story.
Let’s start in Minneapolis.
A short while ago, a bystander filmed a white police officer during a police stop with his knee on a black man’s neck. That black man, George Floyd, could be heard pleading, “I can’t breath,” as he was dying.
That infamous video streaming into millions of television sets around the country was shocking to watch.
An innocent man killed by a callous police officer in front of our eyes.
I haven’t spoken to a single person, including police, who did not express disgust at that horrific act.
Many became so enraged that millions took to the street, despite warnings about social distancing dangers.
As is all too often familiar with large scale protests of this kind, vagrants took advantage of the situation. They chose to loot, pillage, and burn establishments, many in the neighborhoods that desperately need them.
Emerging from the death of George Floyd is a set of beliefs or themes about what is wrong and what to do about it. Informed by personal experience, media recollection of historical similarities, and mass rage, many politicians and the media have described the problem. Some have even leaped to propose solutions based on their understanding of the problem.
But do they understand the problem?
Do they know what’s wrong?
Do they really know what needs to be fixed?
And, most importantly, do they know how to fix it?
Why is this important for all of us?
This tragedy resulted in a troubling and anxiety-filled environment. Amidst the turmoil, I have been confronted with the perspective and slogans to match that say, “Silence is violence.”
Those slogans are right.
Whether caused by institutional racism or some other factor, these incidents trigger intense rage. Rage leads to significant collateral damage to our establishments and collective faith in each other.
No, the violence will not go away until we reach a collective view as to the cause and put fixes in place.
You see, it does not matter whether you think there is systemic racism in police violence or that it’s in isolated parts of policing. The effect is the same. One incident in a local community amplifies into national and increasingly international reactions.
This week I was faced with boarded up shops in the middle of New York City.
Saks Fifth Avenue, Bloomingdales, and other retailers boarded up their windows. It looks like they are expecting a hurricane. And a hurricane did blow in.
Retailers with the boarded windows were the lucky ones. Those who could not afford to, or could not get it done in time lost their merchandise to looters.
Some building managers hired armed security guards to protect their residents and buildings.
This fortress-like life is not America, the land of the free.
Whether an isolated problem or a national problem, it needs to be fixed!
A call to action
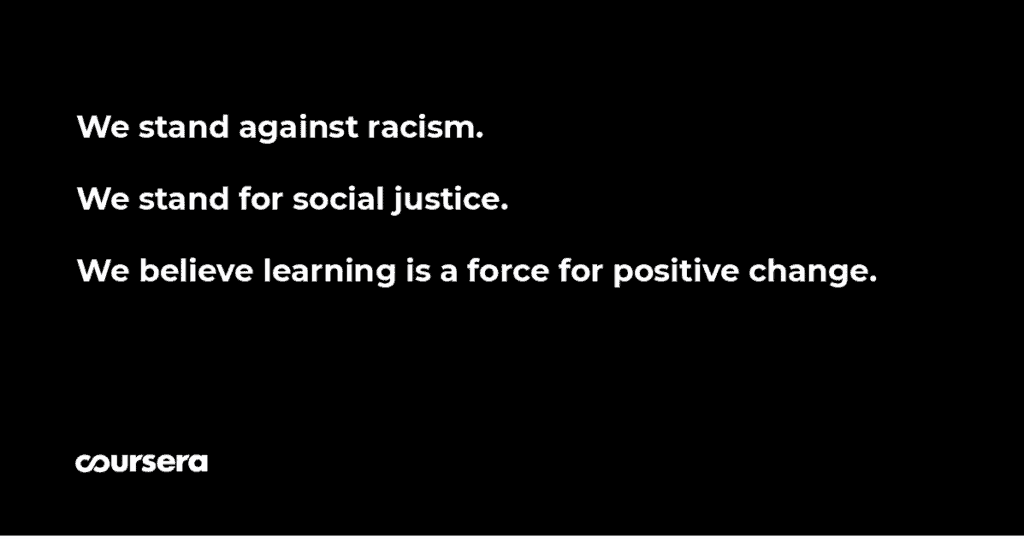
In recent days, I began receiving generally thoughtful communications from respected institutions that were breaking their silence. Coursera sent me a message which had three statements against a black background:
- We stand against racism
- We stand for social justice
- We believe learning is a force for positive change
Being an immigrant man of color, I am absolutely on board with these. I was not sure what to do about the first two. But the third (learning) was the solution to my ignorance.
Asked to lend my voice to any cause, the helicopter view was no longer useful. I had to roll up my sleeves and spend the time digging into the facts to understand the issues at their root.
I believe that positive change is always required, and learning is a great place to start.
Positive change and transformative solutions require more than a cursory overview of the details.
Look, it’s easy to add a banner to your Facebook profile showing that you support “Black Lives Matter.”
It’s easy to buy an NAACP supported ETF, which promotes investment in businesses with anti-discrimination and diversity policies, among other factors.
You can also take a picture of yourself on a knee supporting the cause.
In a polarized political environment, we treat each consequential issue as a way to push votes to one end or another.
We take shortcuts, emblaze the problems with easy, catchy slogans.
And we show our stance by painting our faces, raising a fist, or showing solidarity on Facebook or our favorite social media outlet.
That changes nothing!
Nothing has changed in the decades since this started becoming a visible issue. And each year, the reaction and immediate resultant damage to our establishments, institutions, and society increases.
It’s time to step back and think this through.
If you think the media has given you sufficient facts and the answers, then you are good to go.
If you think your experience informs you, then you probably think you know what the problem is. Maybe you are confident in your solutions. Then you probably should stop reading also.
If you think the politicians you prefer, or have voted for, understand the details and know the answers, you are an ideologue.
May I remind you that many of those politicians have been around for too long. And the problem you think exists has been around as long as those politicians have been in power.
If you are confident with your facts, don’t read further.
Asked to add my voice, I went back to the details to understand the challenge, as best as I can figure it out.
The problem has many facets, and the protests assert some of these. Others are less clear and are bound into the fundamental challenge as all social upheaval moments create opportunities to promote agendas.
In exploring the facts, I wanted to strip away agenda-driven assertions. To make some progress I have decided to stick more closely to the issues initially posed by the George Floyd tragedy.
Do we have a policing violence problem?
Do we have a policing race problem?
Do we have a race problem?
Have we been getting better or worse at dealing with the problem?
All right, tough questions that demand an honest fact-based review.
I can guarantee you that any media outlet you have been reading or watching is telling a story that they want you to believe.
Some outlets highlight police brutality and racism; others want to stop the conversation by showing the wanton destruction of property.
Yes. Regardless of which side you think you are, you are programmed if your source is the media or political manipulation.
The facts?
Well, the facts are boring details that require a little more involvement.
If you want to make a difference, you must roll up your sleeve and understand the issue in a fact-based way.
One can only bring lasting, sustainable change to the world when one understands the underlying challenges and applies solutions appropriately.
If you want to explore the facts, read on.
If you want to do something about the issues we face as a nation, then read on.
A word about the data and the visualizations shown here.
One of the first lessons I learned as a new McKinsey consultant was the value of raw source data or authoritative sources. The second lesson was about using the right visualization, to tell the truth.
Use Authoritative Data and Sources
Whenever possible, I have gone to the raw data available.
When questioning institutions, there is a reluctance to believe official sources. The theme being that there is a cover-up among government agencies of the extent of the problem.
I have used alternative sources (not favorable to police) whenever possible.
The Washington Post is compiling its open-source database of killings by police since 2015, so I used it.
Another group of data scientists have been focusing on mapping and tracking police violence. In their words (sic):
“We cannot wait to know the true scale of police violence against our communities. And in a country where at least three people are killed by police every day, we cannot wait for police departments to provide us with these answers.
This information has been meticulously sourced from the three largest, most comprehensive and impartial crowdsourced databases on police killings in the country: FatalEncounters.org, the US Police Shootings Database and KilledbyPolice.net. We’ve also done extensive original research to further improve the quality and completeness of the data; searching social media, obituaries, criminal records databases, police reports and other sources to identify the race of 90 percent of all victims in the database.
We believe the data represented on this site is the most comprehensive accounting of people killed by police since 2013.”
Well, I used their data too, whenever practical.
In the absence of raw data, I was able to use summarized raw data from a variety of sources identified below.
If there is any bias in the data used, it favors the anti-policing sentiment.
Tell the truth with visualization.
At Mckinsey I recalled being fascinated by Gene Zelazny, the author of a book called “Saying it with Charts.”
Gene had spent a lot of time studying visualizations and could tell the difference between good and misleading charts.
Gene drummed into us the concept of using visualizations which accurately portrayed the reality as opposed to using statistics and visualizations to lie.
How might one use visualizations to lie?
Well, that’s easy, and an activity that is practiced by the unscrupulous today, and very common in supporting media storylines.
For example, one could use colors to obfuscate reality. Attract the audience to areas of the chart that you want them to focus on, not necessarily the most important.
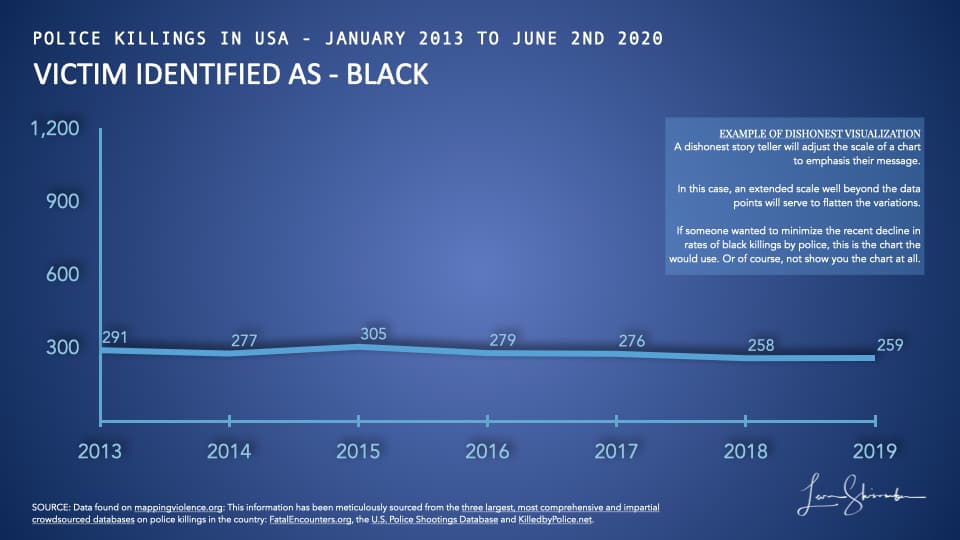
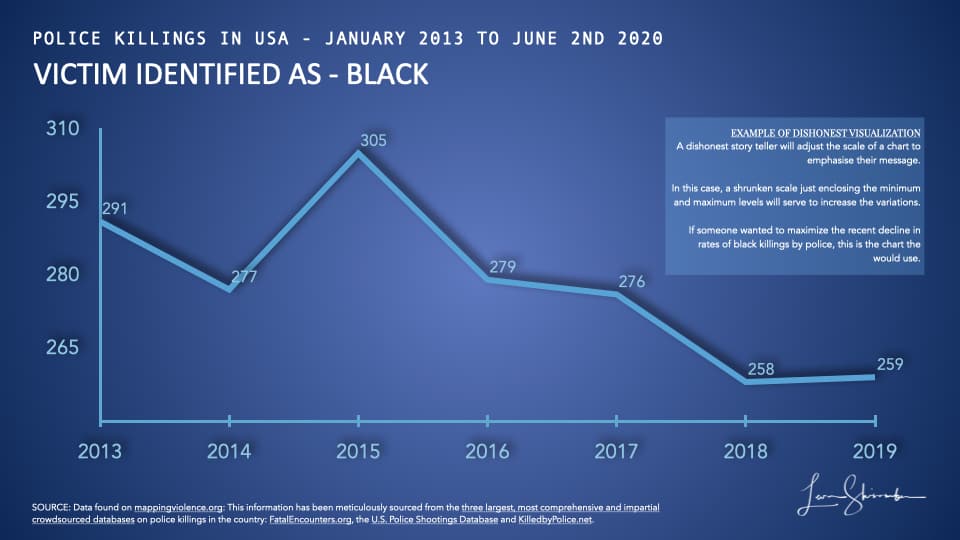
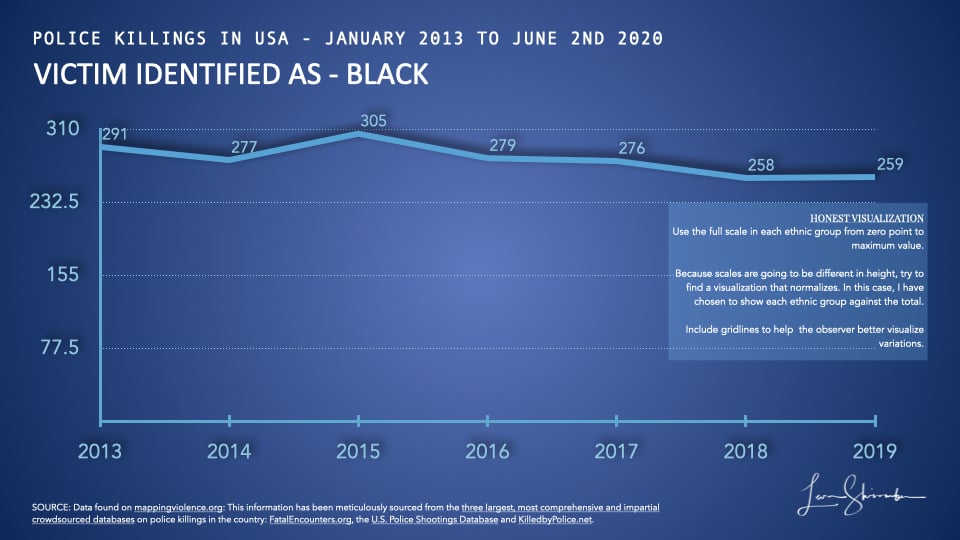
Or one might change the scale of the graph. You use the broadest scale possible, say from zero to the maximum value, to show small variations on a line chart. For higher variability, use a narrower scale range between say the minimum and maximum. I have provided examples at the end of this article.
Correlations are used to suggest causation. Or a writer will string a series of unrelated incidents together as if they are more than coincidence.
Unlike political agendas, in business, we know that un-varnished facts lead to better decisions and those are necessary for better profits.
We learned that it was essential to avoid the practice of story-based visualization, and instead to focus on fact-based visualizations.
Telling the truth with charts is in my blood. So, the visualizations are chosen carefully to ensure that they don’t inadvertently convey any messaging bias.
Now, that’s out of the way, on to the facts!
Police Killings In The USA
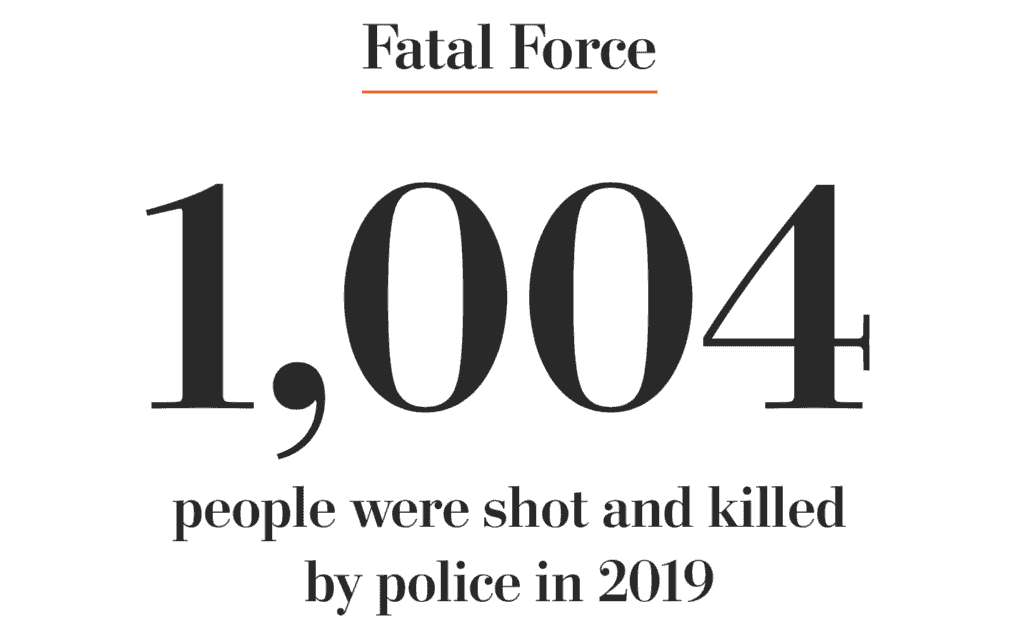
The Washington Post says 1,004 were victims of police killing in 2019.
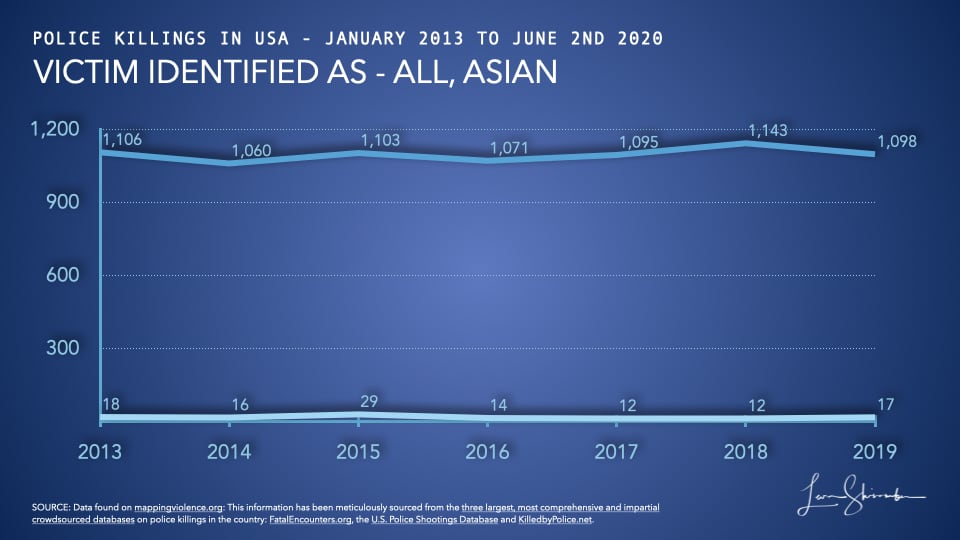
Mapping Violence Database shows a higher 1,098.
Roughly three people die per day from police killings.
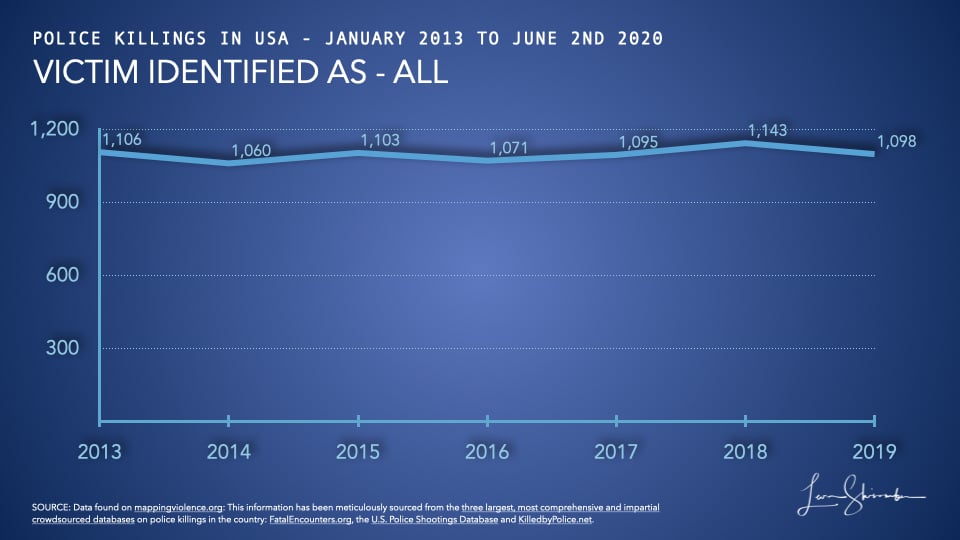
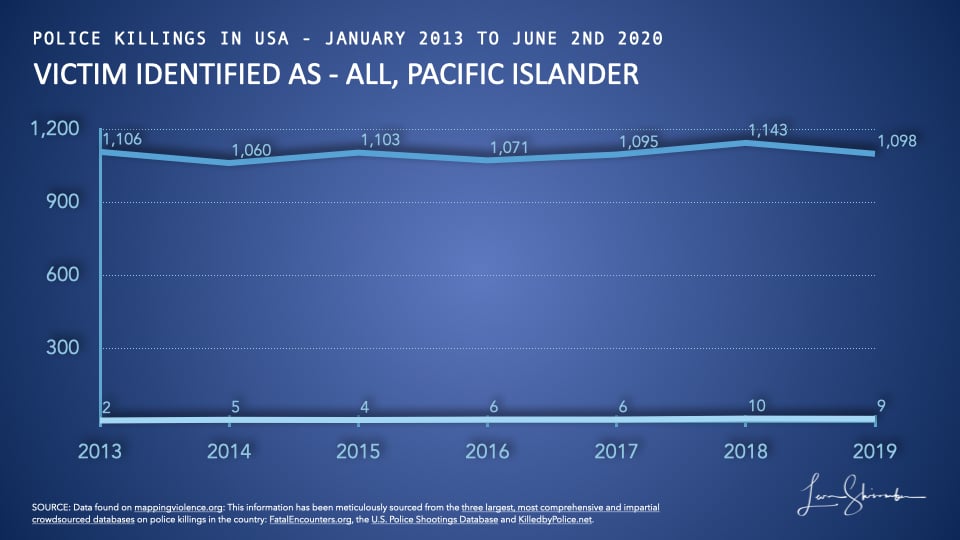
That’s a significant number, which has been relatively stable since 2013. The average for the seven years between 2013 and 2019 is 1,096.
Are 1,098 killings a year by police a sign of radically out of touch policing?
Absolute numbers have a way of misleading, so we need to understand the level of police killings with reference to other potentially related factors. One would expect population and crime rates to be somewhat related, and we will explore those.
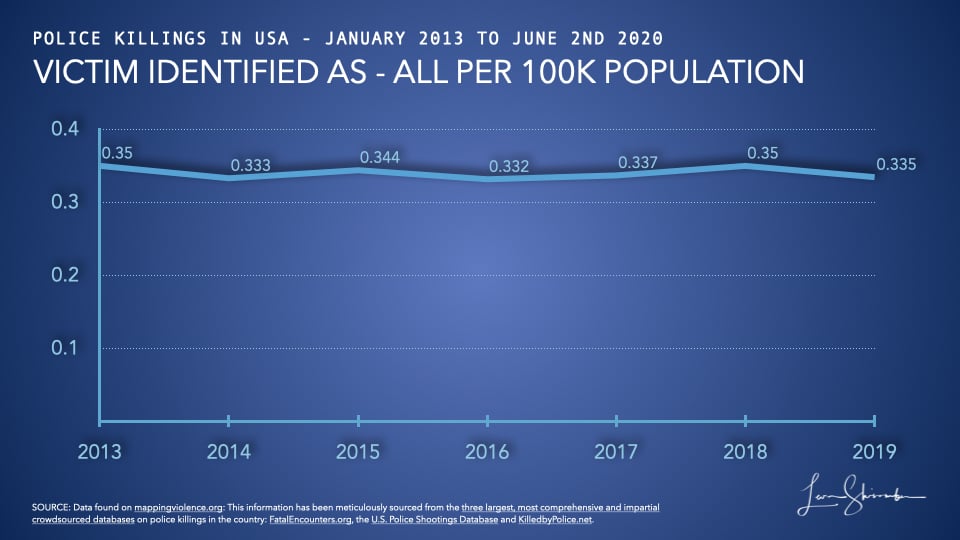
Indeed, when looking at police killings per one hundred thousand population, we observe a small variance. It was about 6 percent for the seven years tracked. The low was 0.3316 in 2016 and the high 0.3500 in 2013 and 2018.
The astute ideological observer might point out that the annual average was lower during the Barack Obama & Joe Biden presidency. It was 1,085, while the average during the Donald Trump & Mike Pence presidency was 1,112, a 2.5% increase.
However, the per capita averages show the Obama/Biden period at 0.3397 versus 0.3404 Trump/Pence period, a 0.23% variance.
Different administrations appear to have varying approaches to tackling the challenge, but very little difference in results.
The argument for a particular presidency regarding police killings is more ideological rather than a recognition of what happens at the front line.
The last complete report on crime in the United States was published in 2018 by the Department of Justice, Federal Bureau of Investigation. Their Uniform Crime Reporting database records 1,245,065 violent crimes. They also have a census estimate of 327,167,434 Americans.
The violent crime figures include the offenses of rape, robbery, aggravated assault, and 16,214 murder and nonnegligent manslaughter.
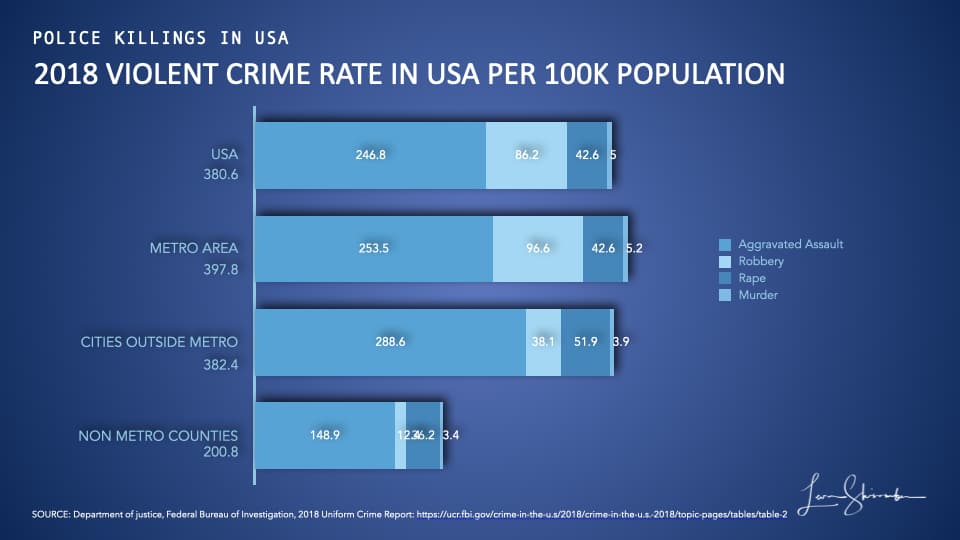
In 2018, the USA had 380.6 violent crimes known to law enforcement per year per 100,000 population!
That same year (2018), the USA had 1,143 police killings, at a rate of 0.35 per 100,000.
That works out to one police killing per 1,089 violent crimes in the USA in 2018.
At the national level, murders in the USA occurred at 4.96 per 100,000, and police killings were once per every 14 murders.
It’s complicated to look at the macro level. Considering the breadth of occurrence, geography, gender, age, and circumstances, it’s hard to determine a systemic failure.
But there is room for improvement. And these national figures can serve as benchmarks against which we can measure communities to determine if there are pockets of outliers.
For that, we need to dig deeper to understand the problem and where it occurs.
But before we go there, we still need to deal with the question of institutional violence and systemic racism.
Are police killings a sign of institutional violence?
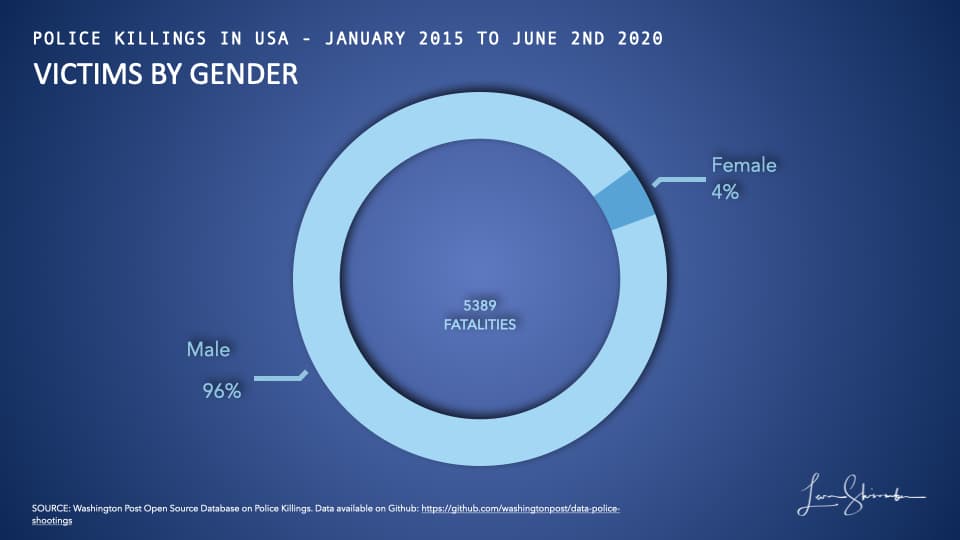
96% of the Victims of police killings are male.
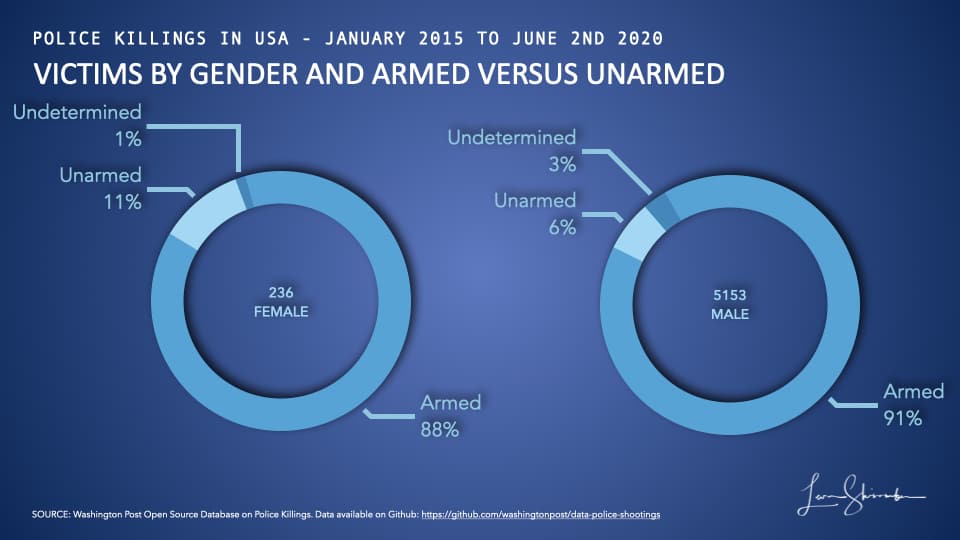
In most cases, the victims are armed (88% of females and 91% of males).
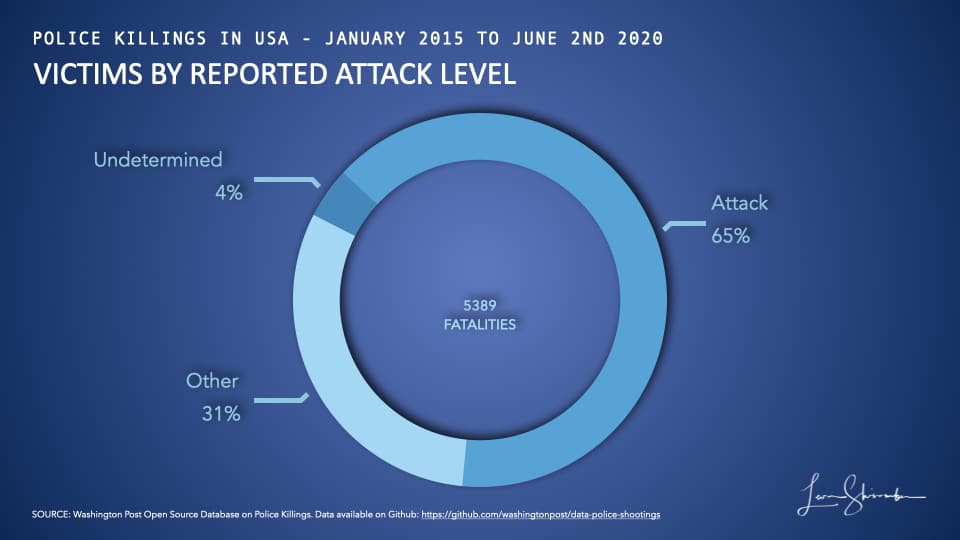
The record indicates 2 out of 3 situations (65%) were attacks by the victim on the police.
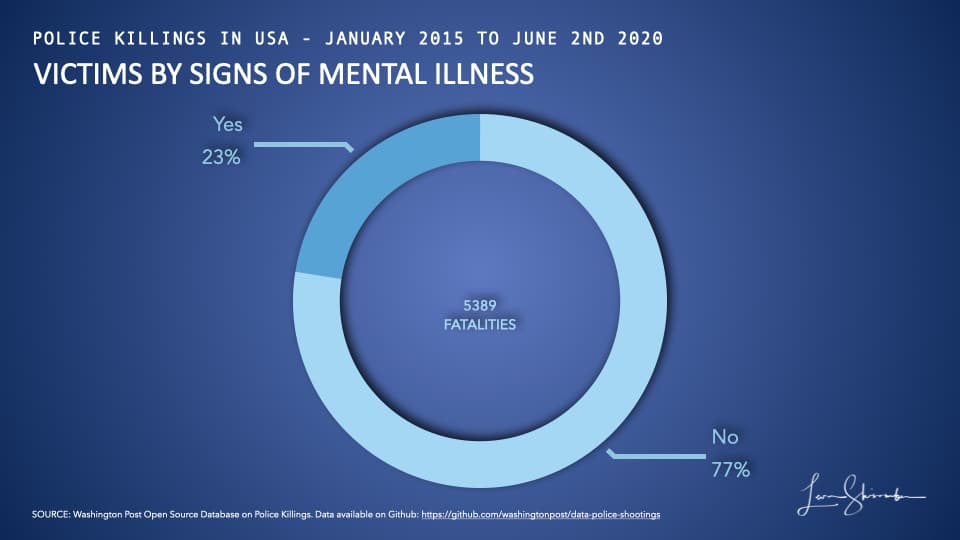
In 3 of 4 situations (77%), there were no signs of mental illness.
Policing is a hazardous vocation.
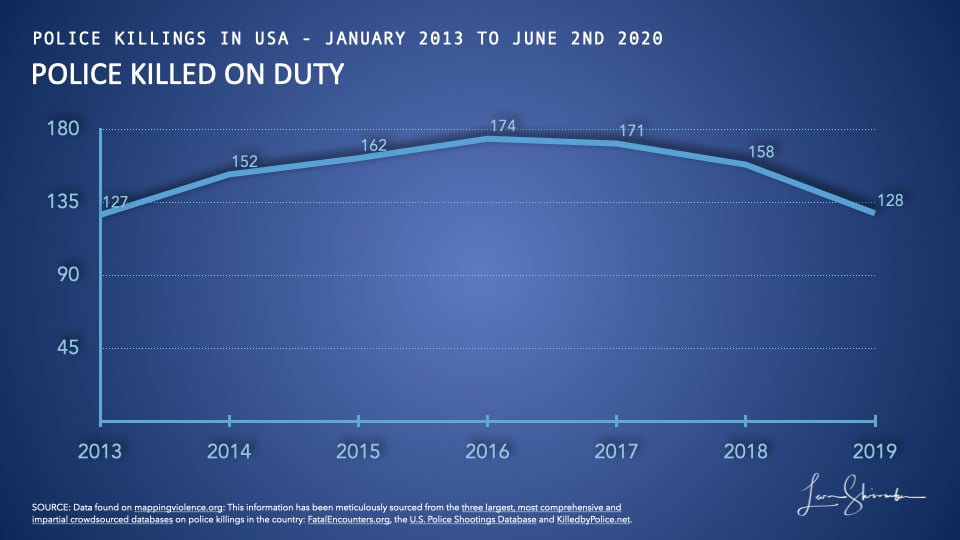
Since 2013, criminals have killed 1,072 police on active duty.
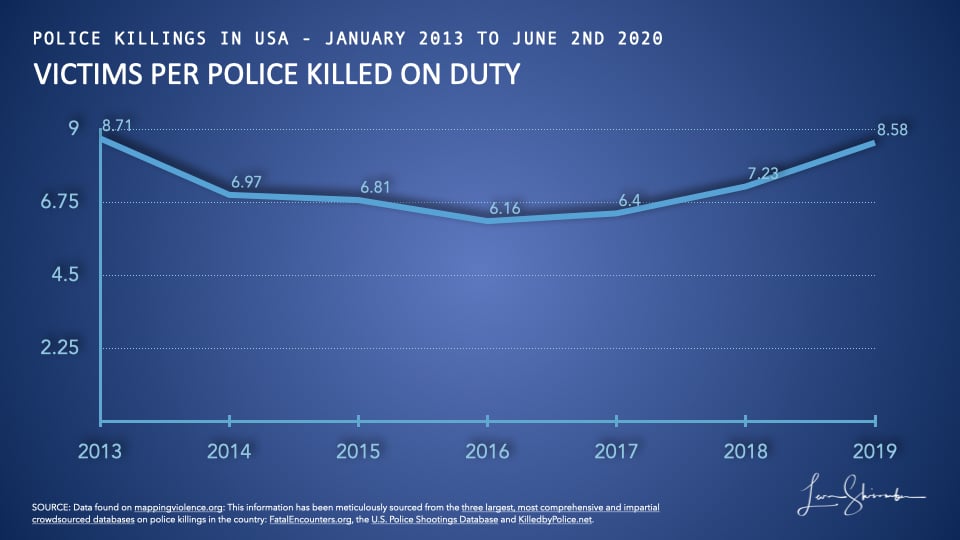
For every seven victims of a police killing, there is a police officer killed.
But, this is not a debate about what happens to the police. It’s about the actions of the police and the institution.
Against the backdrop of the hazards police face every day, I would not choose that vocation, nor wish it of a family member.
I have not found evidence to support the institutionalized violence claim.
When will we know racism in America is no longer?
I have seen comments that if George Floyd were not black, that he would not have died.
We can’t test that hypothesis, but it essentially asserts that the most critical reason for George Floyd’s death was his blackness.
When will we know racism in America does not exist?
Maybe someday we will see the crime independent of race.
Maybe when we see the evil of the individual with their knees on the victim’s neck, before we see the color of the victim?
Unfortunately, that is an individual standard, not particularly useful for identifying systemic failure or institutional racism in America.
Sadly in every tragedy, observers see more than the actual details. They will always imbue the situation with their believed motive.
There must be a more disciplined, measured way of differentiating between individual criminality and institutional racism.
I know that institutional racism is not observed by reviewing individual tragedies. Systemic failure will show up when looking at trends, groups, outliers, and other statistical views of behavior.
Let the facts guide us, not our emotions.
Inter-race violence is not the norm.
In 2018, the Uniform Crime Report on homicides included 3,315 white victims and 2,925 black victims.
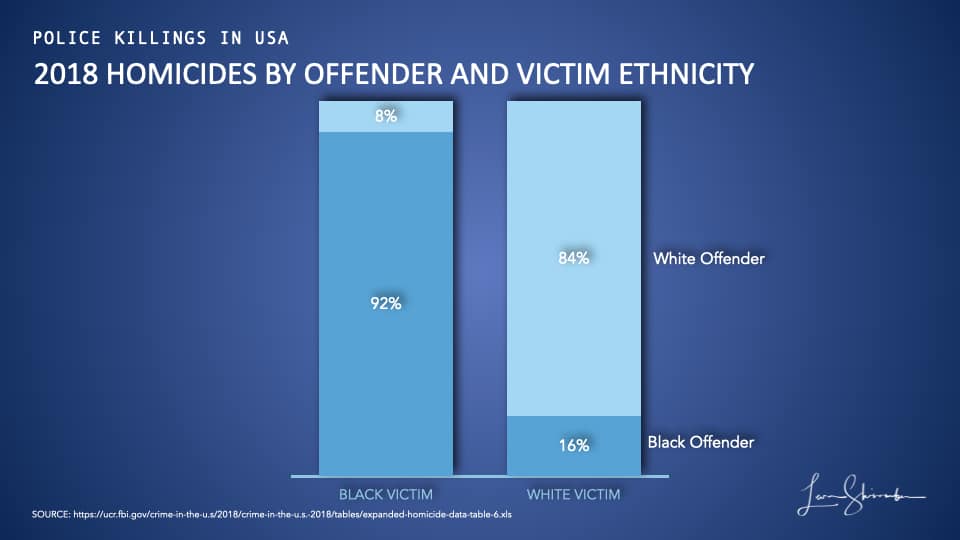
92% of the black victims were fatalities at the hands of black offenders, 84% of the whites by whites.
In the civilian population, inter-race homicides occur, but they are not the norm!
Racial animus is an extremely rare assertion, at least as it relates to the 748 cross-racial homicides in 2018.
Are police disproportionately killing blacks?
Would George Floyd have been alive if he were white?
For us to make that case, we need to find some distinct outliers in police killings versus other measures of interactions between police and blacks.
Let’s start at the top.
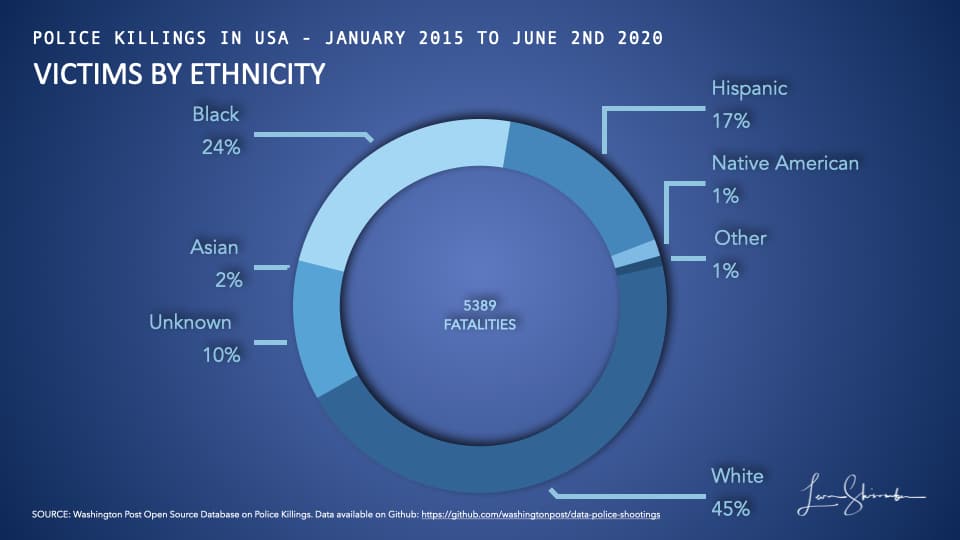
Between 2015 and June 2020, the Washington Post data shows that 24% of the 5,389 police fatalities were black.
The census estimates the black population at about 13.4%.
So at first glance, one might conclude that black police fatalities at the national level are biased.
However, census estimates of blacks vary dramatically by state from the low 0.4% in Montana to 45.3% in the District of Colombia. The data also shows that blacks are approximately 20% of the largest metropolitan areas.
There is a problem.
We just can’t say it’s a national problem yet.
We will need further investigation to discern the case one way or the other more definitively.
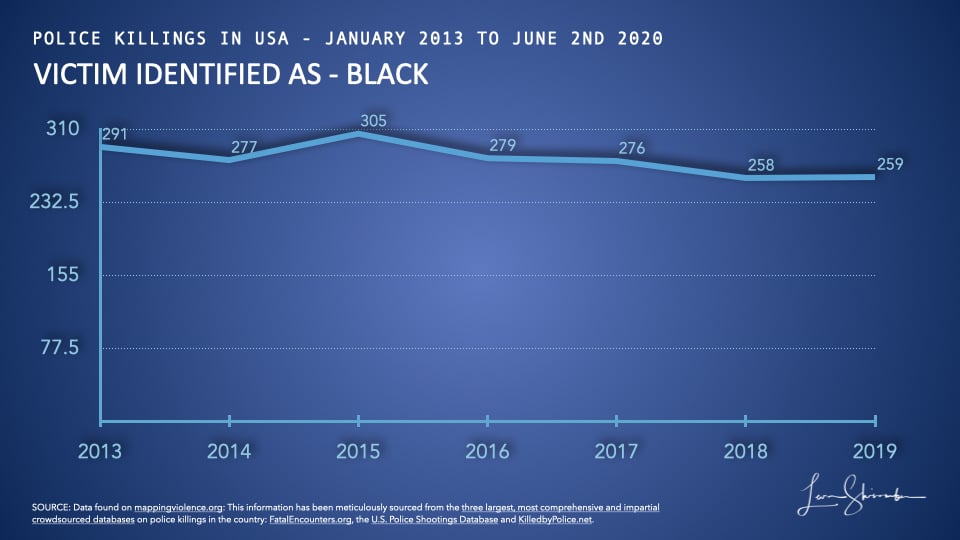
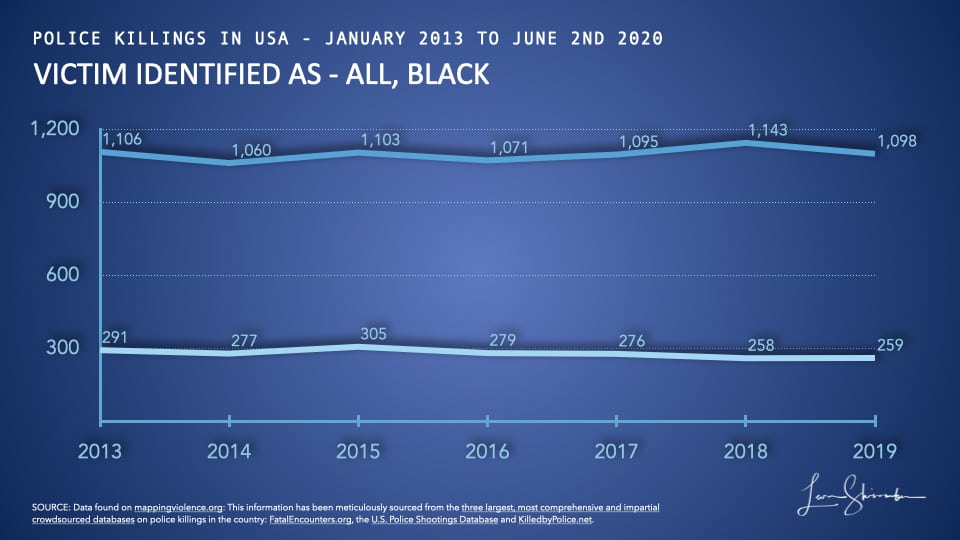
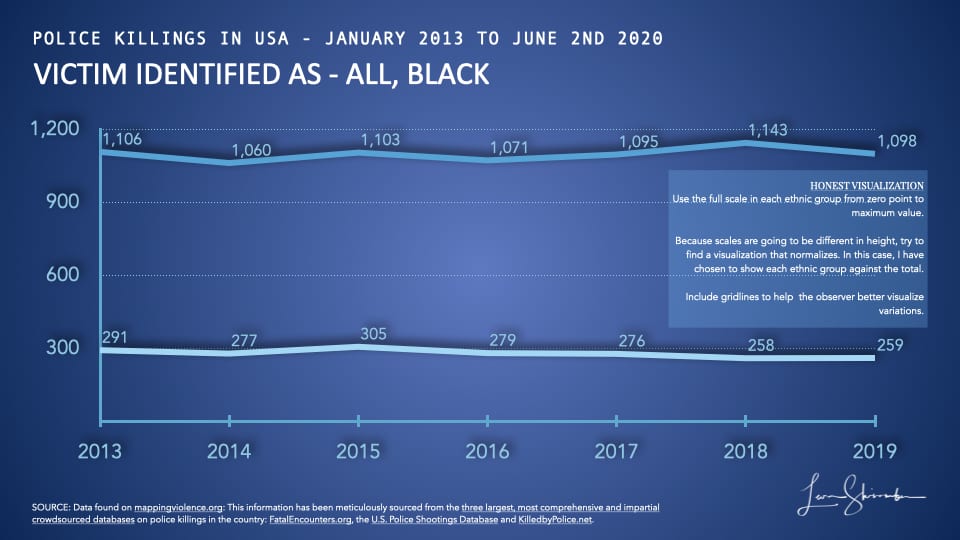
From 2013 to 2019, the number of Blacks killed by police varied by about 18%. The high mark was 305 in 2015, and the low was 258.
For those ideologically inclined, the average number of blacks killed was 288 during the Obama/Biden years. The number averaged 8 percent lower at 264 during the Trump/Pence years. On a per-capita basis, the decline is probably a little higher.
If you are on the right and support Donald Trump, you will argue that his administration has driven better results.
The left can’t explain how the Trump leadership, which they claim is racist, end up with lower black unemployment and fewer black police victims.
The facts don’t support an ideological narrative of the “racist Trump regime,” driving worst race results.
Astute observers on the left posit that the large number of consent decrees pushed by the Obama/Biden presidency drove the decline. They warn that the Trump/Pence administration push to reduce the impact of consent decrees will cause the problem to escalate again.
Both arguments will resonate will their respective audiences, but neither will decidedly lead us to the path out of the problem.
I have no data to suggest that police criminality is any higher than civilian crime.
In our judicial system we assume innocence until proven guilt.
Let’s hypothesize that the majority of police killings are related to the overall situation with violence and crime than any ideological approach.
Let’s just follow the facts.
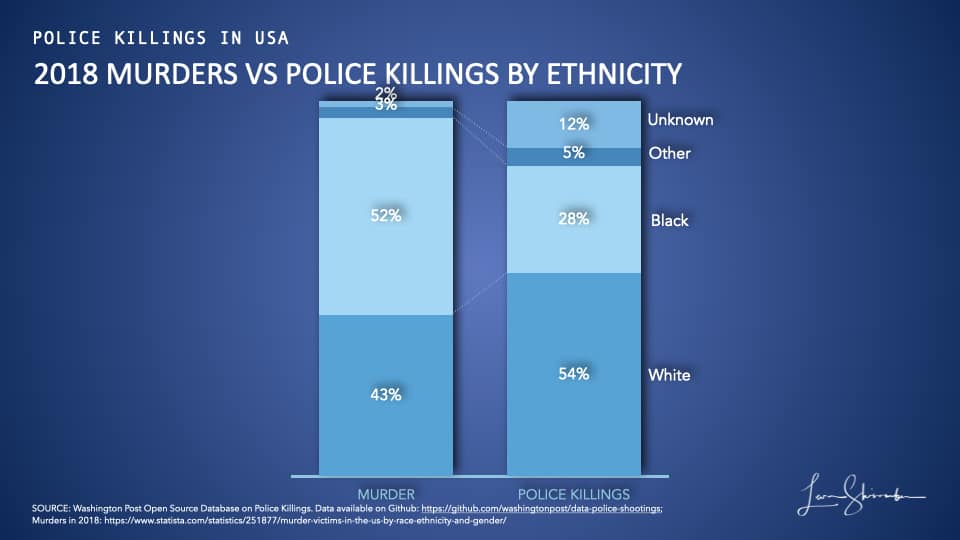
In 2018, black victims were 52% of murders nationwide. Black victims were 28% of police killings that year.
Civilians are killing blacks at almost two times higher rates than the police are killing blacks!
That comparison on its own would suggest that police are not systematically and prejudicially murdering blacks.
But we do know that corrupt police officers have killed innocent blacks. So have bad officers killed victims in other races. In those cases where the victim is of another race, the media has paid much less attention. The inherently biased publicity leads to the presumption that when bad policing occurs, its racist.
Police violence occurs.
Police bias exists.
The question is, how big a problem is it? How widespread or localized, is it?
Answers to those questions can ultimately lead to better solutions.
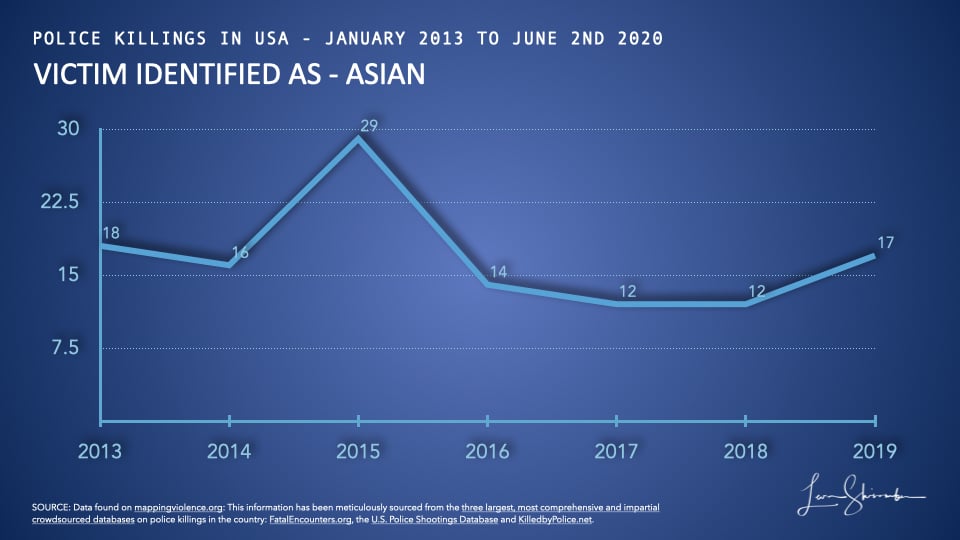
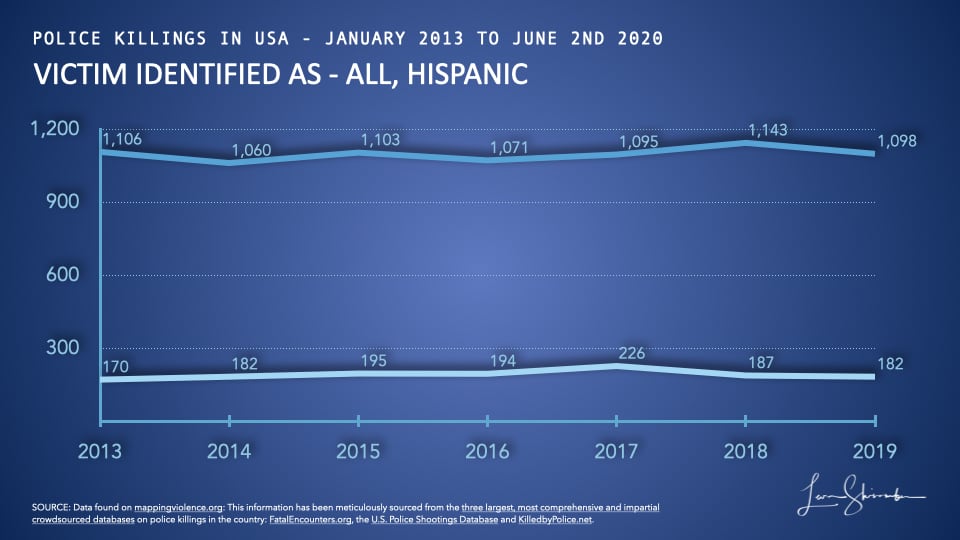
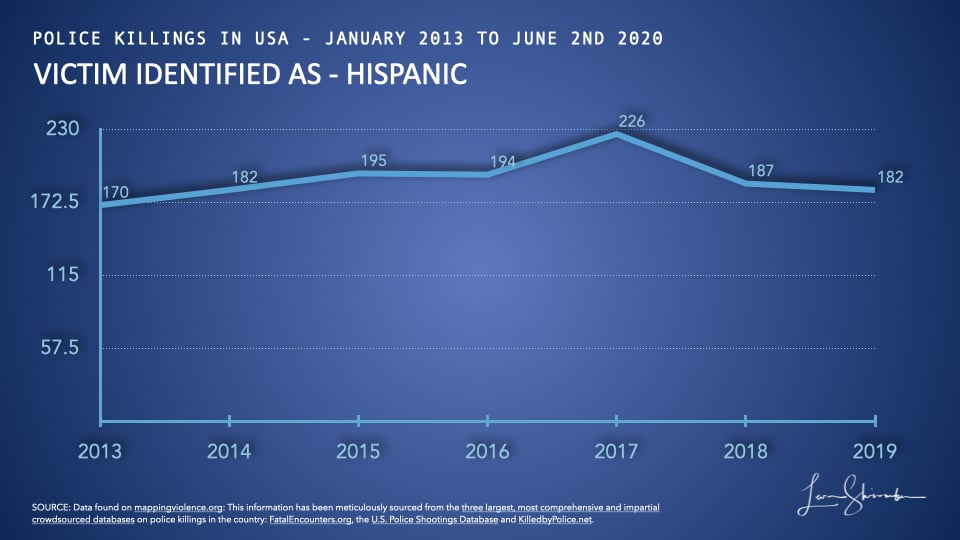
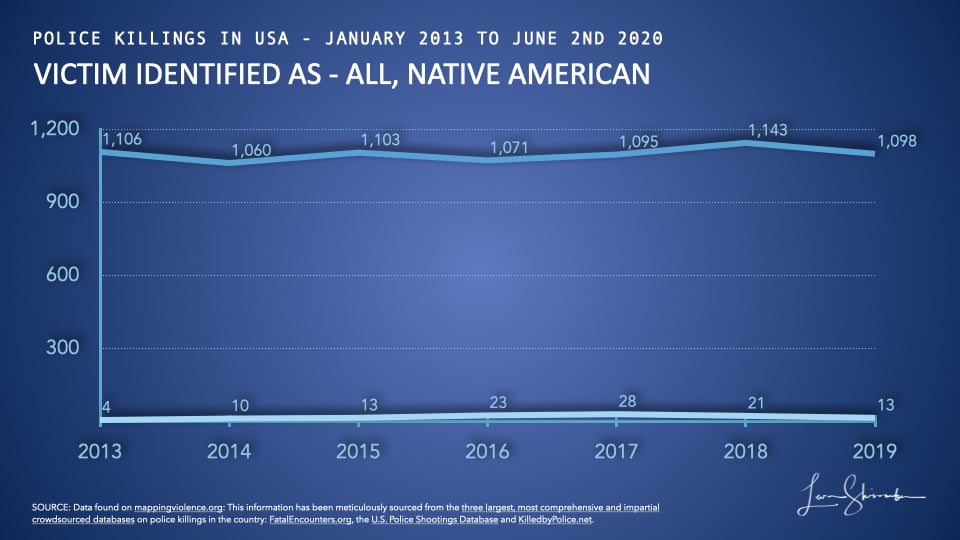
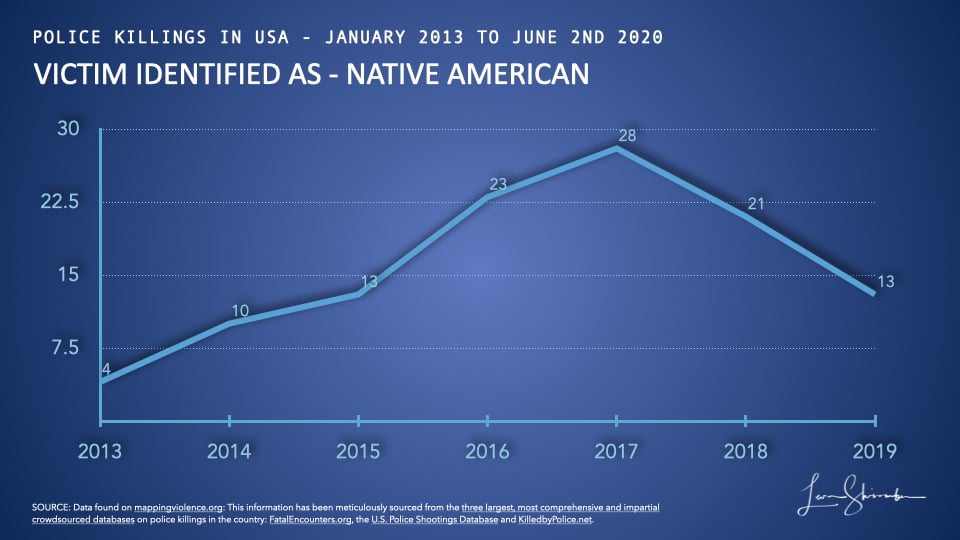
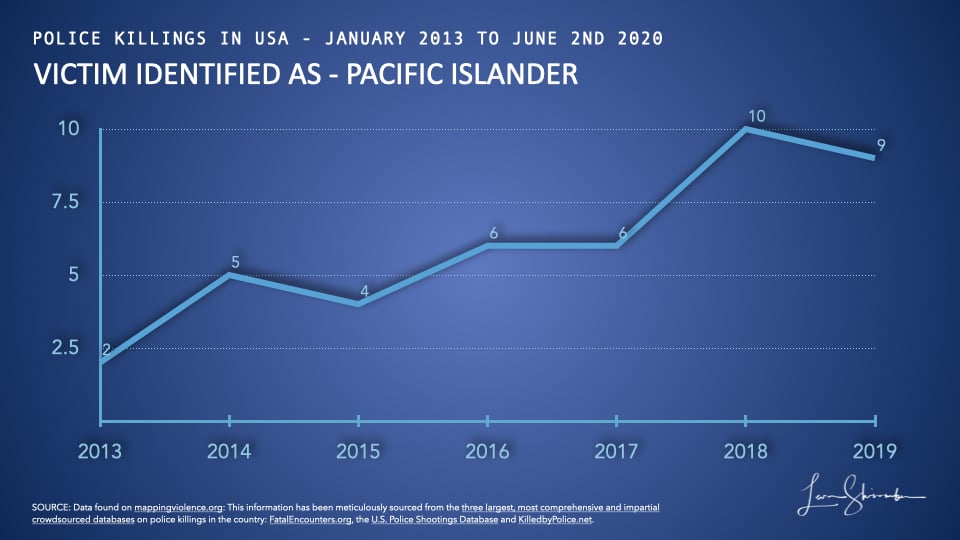
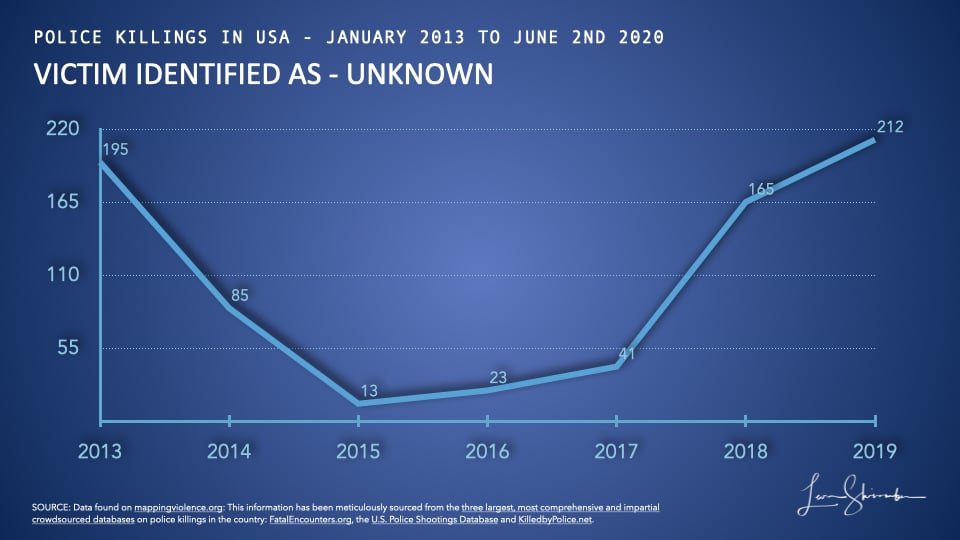
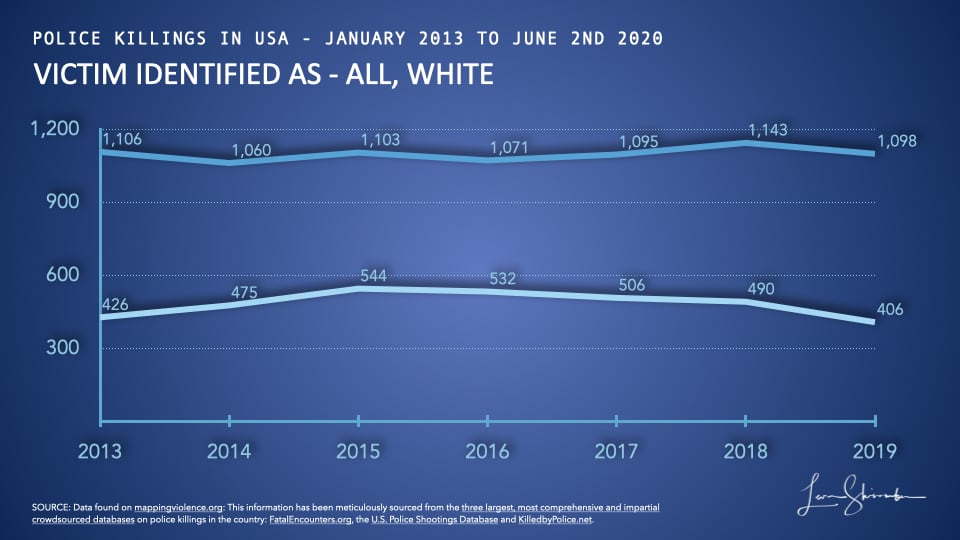
Note: For completeness, I have provided charts for all police killings for all ethnicities tracked. There are some interesting observations from those charts. However, I will skip addressing those here in the interest of focusing on the primary topic of our time.
Where is the police violence problem?
In the USA, only one police department, Irvine California, did not have a single police killing since 2013.
At the national level, police killings occur at a rate of 6.5% of violent crimes, specifically homicides.
That rate is 6.0% for the largest 100 police departments, suggesting a higher level of police killings outside the top 100 police departments.
However, the national rate of blacks killed by police is higher in the top 100 police departments. The national average is 0.66 per 100,000, while that rate was 0.85 in the top 100 police departments.
In other words, smaller police departments may have a police violence problem, but they appear to have a better track record of police killing blacks at the macro level.
The data for smaller police departments suffer from the “small number” problem and represent a smaller effect (Pareto rule).
The purpose of the analysis is to reach a conclusion, so in the interest of concluding, I will leave the exploration of smaller police departments to others.
I will say that the exploration of smaller departments is essential. That is because an unjustified killing of anyone in any department can spark a spin to national outrage.
For now, back to the 100 largest police departments.
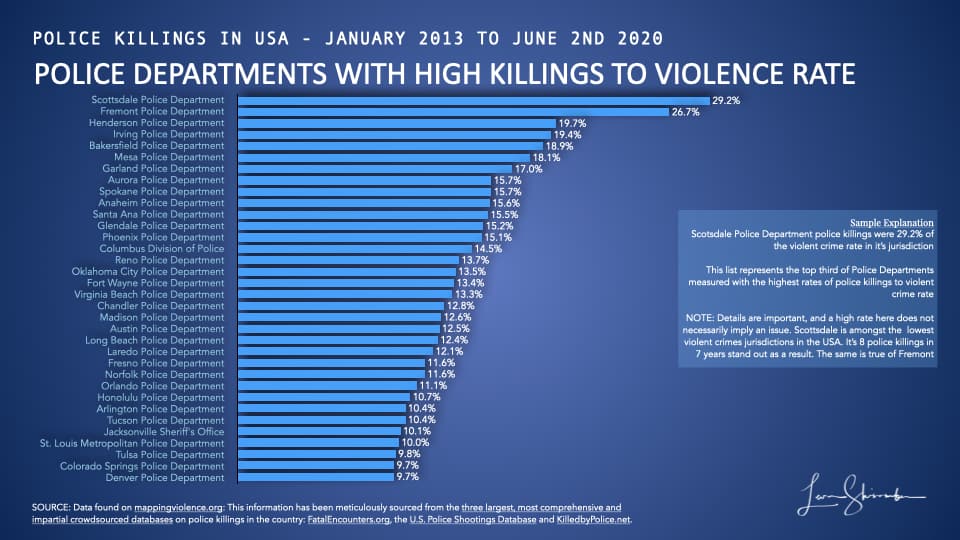
Police departments showing high rates of police killings compared to their violent crime rates are a good starting point. Be careful though, since police shootings are infrequent in some departments, a single instance will stick out (see the sample explanation on the chart).
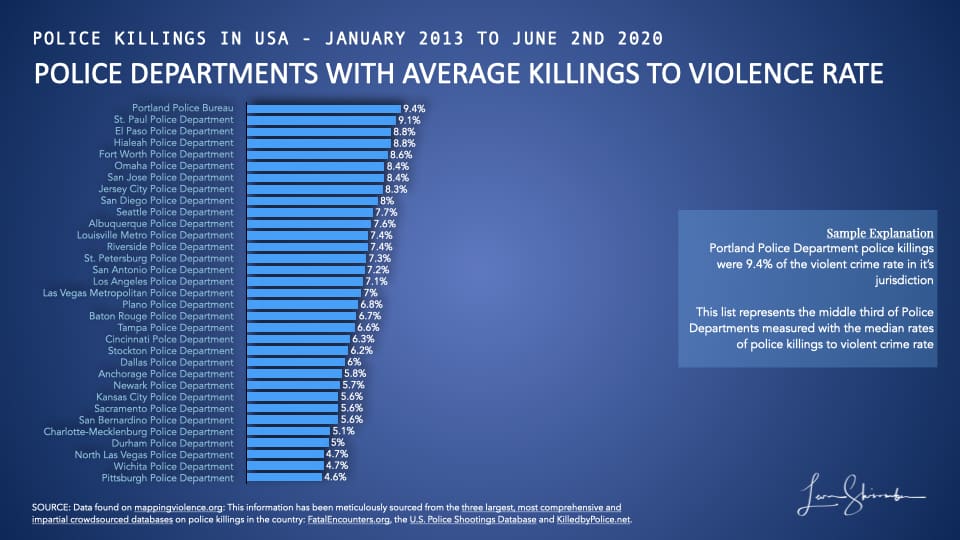
The national average of police killings versus violent crime rate by jurisdiction is at 6.5%.
Median police departments range between a low of 4.6% and a high of 9.4%
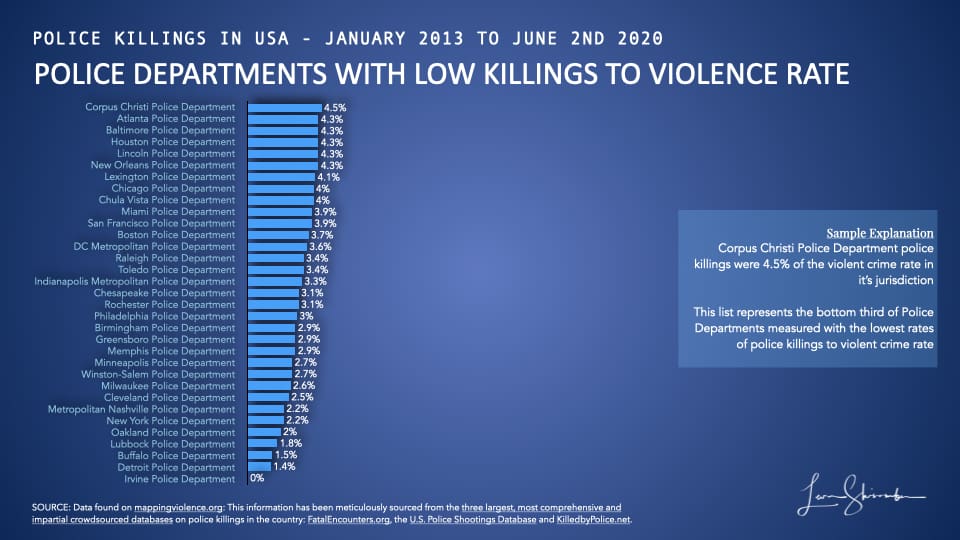
The best police departments in the country achieve rates of police killings at less than 4.6% of the homicide rate in their jurisdiction.
You have seen the recent calls by politicians arguing for the defunding of their police departments.
The George Floyd tragedy occurred in Minneapolis, and the politicians there have quickly moved to talk about defunding that police department.
Where does the Minneapolis Police Department fall in comparison to the national performance on police killings?
I am currently in New York City. Here, the New York Police Department is frequently criticized and trotted out as a violent and racist institution. The Mayor has publicly announced a move to defund the NYPD.
How does the NYPD compare among the top 100 US police departments regarding police killings?
The NYPD is the 5th lowest rate of police killings per homicide, while the Minneapolis Police Department is tenth lowest.
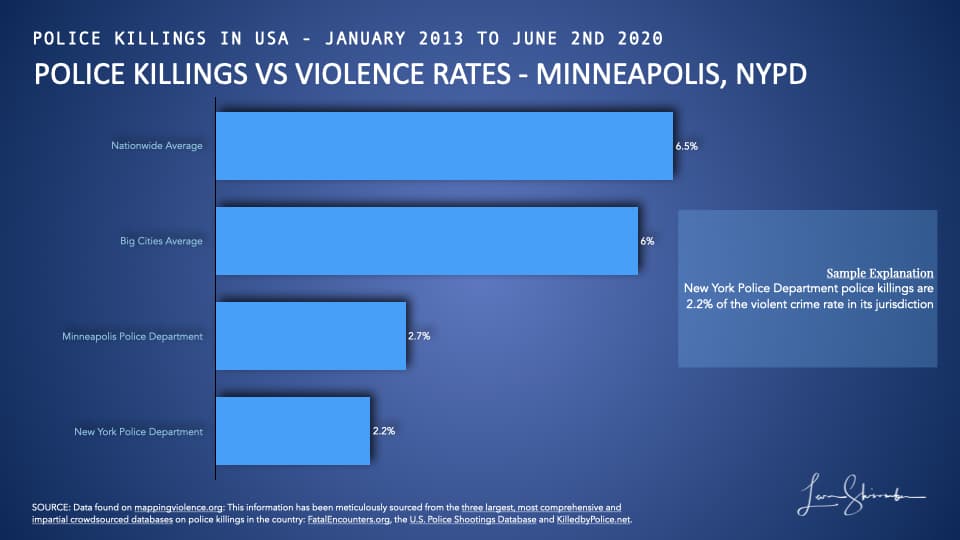
That’s right folks. The “defund the police” crowd is actually targeting two of the best police departments. Certainly, when it comes to police killings versus violent crimes in their jurisdiction, they are among the best.
Wait a minute; I hear you saying.
The George Floyd tragedy is not about generalized police killings.
It is really about systemic police racism.
A national political leader describes it as “the knee of white men has always been on the necks of blacks, keeping us from breathing.”
The rate of black police killings at the national level does not appear to be extraordinary vis-a-vis black civilian murders or crime rates.
That’s not true at the local level.
The data suggests a wide variation.
Police killings of blacks occur at a rate of 0.66 per 100,000 versus the lower 0.34 for all races, nationwide.
In other words, Blacks are killed at twice the per capita rate than others by the police. However, If blacks commit violent crimes at twice the per capita rate, then the killings correlate with crime rather than race.
An important aside
I will not use incarceration rates because I believe the justice system was rigged against blacks for some time.
Indeed, I would argue that the Violent Crime Control and Law Enforcement Act of 1994, unleashed a hefty penalty on the black community.
A reminder to the ideologues, that law was written mainly by Joe Biden, then Chairman of the Senate Judiciary Committee.
Both parties largely supported it, and even a majority of the Congressional Black Caucus.It is an example of well-intentioned change with explosive unintended consequences that politics tends to unleash.
The result?
Blacks were prosecuted for drug crimes at an extraordinarily high rate resulting in equally high incarceration rates for relatively petty crimes.
As a nation, we are still unwinding and need to continue to make progress on this injustice.
For our purposes, let’s choose a more accurate measure. The murder rate should have less debate about its accuracy and represent the highest level of risk among crimes.
In 2018, murders nationwide occurred at a rate of 5.12 per 100,000 overall while it was 15.01 for blacks. That is according to Uniform Crime Rate reporting by the FBI.
In other words, blacks commit murders at approximately three times the rates of others nationwide.
For identifying outlier police departments, we look for police killings of blacks more than three times the overall average.
To be most precise, this analysis should be conducted using each jurisdictions’ murder rate. And, the details matter.
For example, Lincoln Nebraska has had three police killings in seven years, 2 of which were black. The rate of black killings is 17 times the overall number. However, that ratio is more driven by the small sample size than it says about racism.
The small sample problem makes it difficult to draw systemic conclusions.
We will limit ourselves to the police departments that have had at least seven blacks killed by police in the last seven years. This filter does reduce the small sample size problem but does not eliminate it, unfortunately. However, we must start somewhere.
Minneapolis does not even make the chart with only four deaths in the last seven years. Five after the George Floyd tragedy.
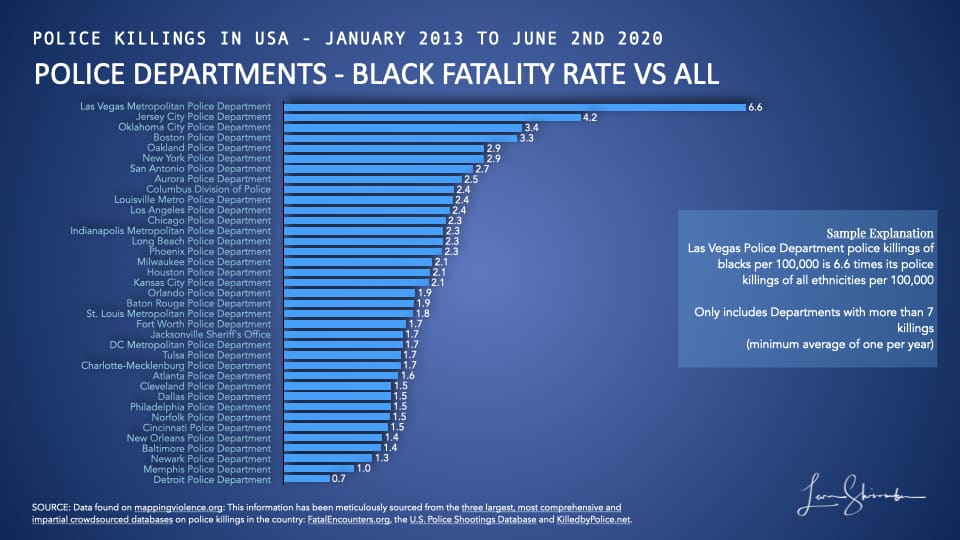
Of those 37 largest police departments, four of them show elevated rates of black killings. They are Las Vegas, Jersey City, Oklahoma, and Boston.
That does not mean there is racism inherent in their police killings. It just warrants further detailed investigation against the crime demographics of those departments.
I would encourage politicians and community data scientists to perform the analysis for your jurisdiction and have a fact-based review of your police department.
The hypocrisy of the pundits.
You may have noticed that Minneapolis and New York City both have excellent track records on police killings.
They have high ratios of police killings of blacks to all police killings, 2.9 for New York, and 2.7 for Minneapolis. But they are also below the nationwide baseline for black murders to all murders (3.0).
So why the impulse to defund these departments?
You ever notice the people telling you that we need to defund the police, that we literally need less policing, all have their own security details (private or publicly funded)?
Or, how about the people telling you that we need more body cams on the police? Why won’t they support street cameras and speed radars?
Why does the defund the police movement push technology companies to stop developing useful technology that could help reduce police physical interactions? Such as facial recognition?
Have we reached the point in our society where crime is less a problem, that we should reduce the need for policing?
The sad reality is that we live in a politically charged environment filled with loud, angry voices, enraged by agenda-driven messages.
There just isn’t enough fact-based analysis and constructive dialogue forcing us to close the gap, perceived or real.
So what should we do?
- Continue the progress and accelerate social justice reforms, particularly those aimed at dealing with long-term sentences for minor offenses. We have to make prisons centers for personal transformation rather than crime factories.
- Public scrutiny of police is necessary and should be fact-based. We need transparency in policing as well as criminal activity. We need data scientists in police departments (like we have seen in health care), codifying best practices and highlighting problem areas.
- Accelerate the roll-out of body cams and public safety cameras. It’s great for the police and its good for the public. Sorry privacy advocates, your argument does not really work well here.
- In the NFL, referees are recorded, their performance measured, and they receive a report card a the end of each game. With technology, we can help the police improve.
- All cops know and feel the impact of a corrupt action by one of their own. The collateral damage to police around the country after each evil act endangers all. It is in the interest of each police to root out their corrupt colleagues.
- Acknowledge that historical institutional racism takes a long time to change and recognize that views and experiences do inform individual reactions to what happens around us. There has been enormous progress, but racism still exists. Let’s work to eradicate racism.
- Understand that people who support Black Lives Matter are not saying that other lives don’t matter. They are saying that they want you to acknowledge that black lives matter. They do!
- If you support black lives matter, don’t act like the only black lives that matter is the black life taken by a criminal cop. All black lives matter!
- Understand that people who object to kneeling during the national anthem are not saying that black lives don’t matter. They are saying that this act is disrespectful to the national anthem or the flag. To them, the flag and anthem are symbols of a nation that strives to provide the rights and freedoms of its people. I am confident there is an infinite number of more acceptable alternative ways to protest.
- Our country is not racist. It does not promote racism. It is the most diverse and free country in the world. Travel the world. Try to experience other cultures, and acknowledge the many privileges we have as a nation while understanding that not every citizen participates equally. At the same time, racism in America still exists. Let’s work to eradicate racism and lift those left behind.
- Elect politicians that have leadership skills, who understand details, are fact-based and focused on solving your community challenges. How much time do our politicians spend understanding the challenges of their community? When a politician says they know what the people want, how do they know that? How much time are they spending talking rather than listening?
- Maybe we should consider returning to the view of politicians held by our founding fathers. Politics was for amateurs, and never intended as a profession. Perhaps we ought to be having a conversation about defunding politicians instead.
- Finally, if you see your preferred media source as an authoritative source on anything, then you should be comfortable with misinformation. Sadly, today’s media is nothing more than a biased business with an agenda. It’s essential to get a diverse perspective, especially those divergent from yours.
Sources and references:
Murders in 2018: https://www.statista.com/statistics/251877/murder-victims-in-the-us-by-race-ethnicity-and-gender/
Murders by ethnicity of the offender in 2018: https://ucr.fbi.gov/crime-in-the-u.s/2018/crime-in-the-u.s.-2018/tables/expanded-homicide-data-table-3.xls
Violent crimes known to law enforcement UCR:
https://ucr.fbi.gov/crime-in-the-u.s/2018/crime-in-the-u.s.-2018/topic-pages/tables/table-2
Census Population estimates:
https://www.census.gov/quickfacts/fact/table/US/IPE120218
https://data.world/data-society/fatal-police-shootings
https://mappingpoliceviolence.org/aboutthedata
https://www.statista.com/chart/21872/map-of-police-violence-against-black-americans/
https://www.census.gov/quickfacts/fact/table/US/IPE120218
https://mappingpoliceviolence.org
Bad Science or deliberate manipulation?
There is so much corruption in reporting and data science that I can understand why emotions on both sides are in the current state.
I could spend a lifetime pointing out the issues with the way data is being hurled at us, but that would be too tiring and useless.
There are large audiences that only want to hear stories that feed their beliefs. And, there is too much money to be made in telling the story that some want to be told.
All i can say is that its irresponsible.
Here is a small sample of what I ran into during my education on this topic.
Judge for yourself.
Examples of Media Conflation
I received an email from the Economist, a highly regarded news organization based in the UK but known for its international focus.
The subject is A special edition “on racial injustice in America.”
Here is what the second paragraph says (sic):
“… African-Americans are nearly three times likelier than whites to be killed by police. In fact, being killed by police is now the sixth-leading cause of death for young black men.”
Statista published an article on June 2, 2020, headlined “Black Americans 2.5X More Likely Than Whites to Be Killed By Police.”
In the Statista article, it links to its source. It says: “In 2019 data of all police killings in the country compiled by Mapping Police Violence, black Americans were nearly three times more likely to die from police than white Americans.“
Are African Americans nearly three times likelier than whites to be killed by police?
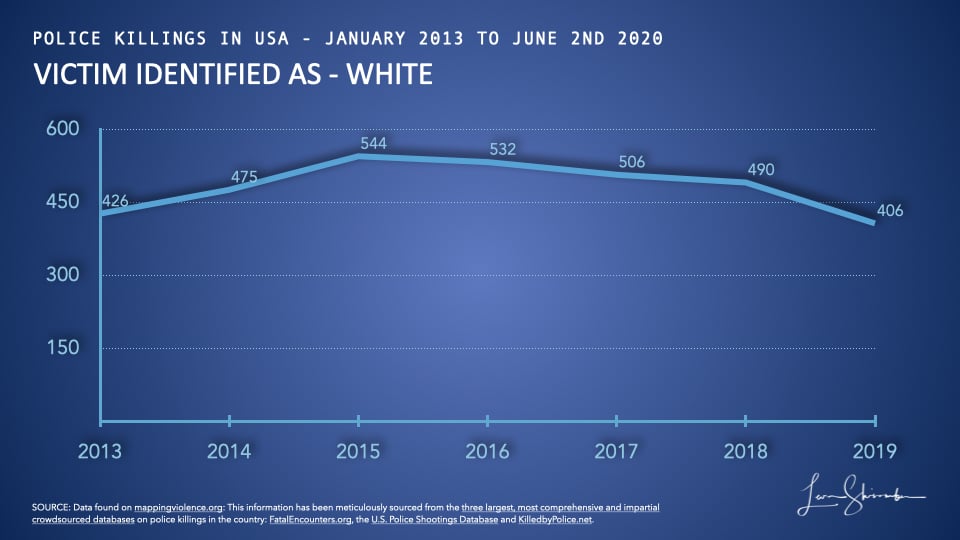
Fortunately, the data is available and shows in 2019, 406 whites killed by police and 259 blacks. That works out to be a per capita rate of 6.15 per million for Blacks and 2.06 for whites. Yes, nearly three.
But is it accurate?
None of the writers or analysts point out that 2019 data has the highest ever recorded number of police killings with an unknown race. The 212 unknown represent 19% of the database that year.
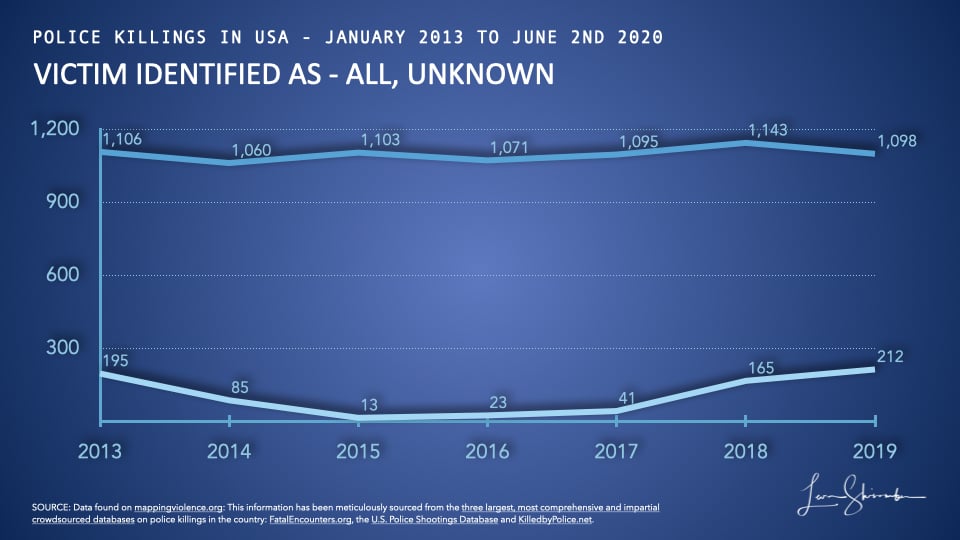
In 2018, unknowns were 14.4%.
For the full period from 2013 to 2019, unknowns totaled 734 of the 7,676 killings or 9.6% of the database.
If we take the three years with the lowest unknowns (2015, 2016, and 2017), the unknowns are a meager 77 representing 3.3% of those years.
In those years, 860 blacks were killed by police, while 1,582 were whites. That works out to 6.81 per million blacks versus 2.68 for whites. The ratio is now 2.54.
Per capita rates are heavily dependent on your population estimates. If we use the census estimates for 2019 we have a population of 328.2 million Americans. In that group 60.4% are white (not Hispanic or Latino) and 13.4% are black (ignoring mixed). Using the 2019 estimates, we get rates of 6.51 per million blacks and 2.66 per million whites. The ratio is now 2.45.
I can hear you saying, boy, this is complicated, and what’s the difference? It’s a big number, right?
The point is data is extremely fungible and susceptible to manipulation and misinterpretation.
The difference between 2.45 and three is significant when we are talking in a politically charged emotional environment.
Moreover, the number should be relevant.
Neither the 2.45 nor the three are relevant.
The denominator is wrong.
One would assume that police killing occurs primarily during crime encounters. On that basis, the police killings by race differences are minimal.
Using the wrong metrics deliberately is shameful manipulation. We need responsible data scientists and media to tell the unvarnished truth.
Another Example of misleading facts
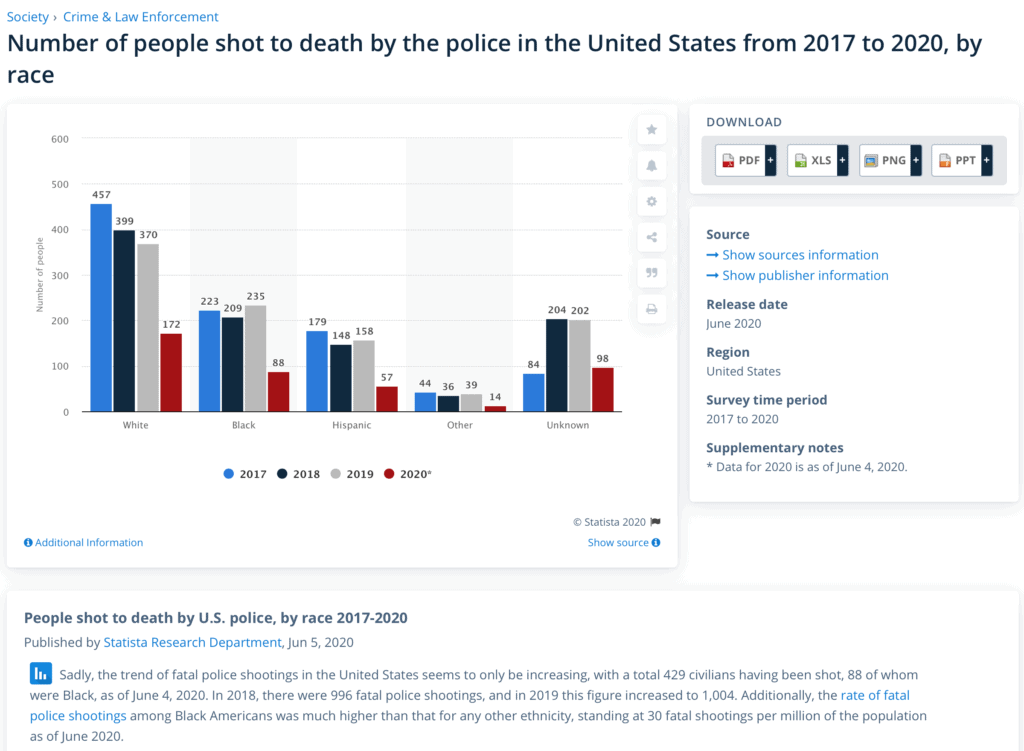
The Statista Research Department on June 5, 2020, publishes the following (sic):
“Sadly, the trend of fatal police shootings in the United States seems to only be increasing, with a total 429 civilians having been shot, 88 of whom were Black, as of June 4, 2020. In 2018, there were 996 fatal police shootings, and in 2019 this figure increased to 1,004. Additionally, the rate of fatal police shootings among Black Americans was much higher than that for any other ethnicity, standing at 30 fatal shootings per million of the population as of June 2020.”
The casual reader is likely to read that police killings are getting worse, and black police killings are getting worse.
As of June 4, 2020, we have experienced 156 of this 366-day year. The 429 killed by June 4 would annualize at the rate of 1,006 for the year. That number is slightly higher than Statista records of 996 in 2018 and 1,004 in 2019. But it’s well below Mapping Violence numbers of 1,143 and 1,098, respectively.
More importantly, the 88 blacks killed by police as of June 4 would equate to an annual rate of 206 for 2020. That annualized rate is lower than the 223 in 2017, 209 in 2018, and the 235 in 2019 shown on the Statista chart.
At an annualized rate of 206, the number would be the lowest in the seven years tracked by Mapping Violence!
It’s misleading to place one fact in the proximity of another point, and let the reader assume a similar relationship.
Examples of data misrepresentation
On the mapping violence website, there are a few charts that purport to show the extremity of challenged police departments.
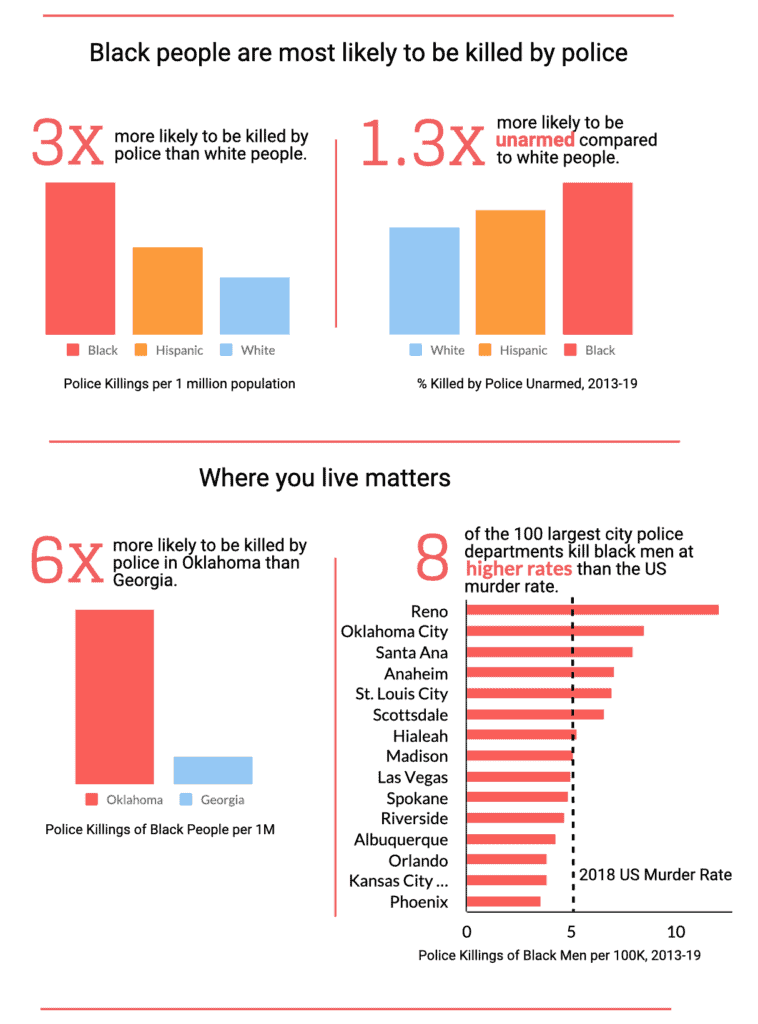
One example highlights with a chart that blacks are six times more likely to be killed by police in Oklahoma than Georgia. The Oklahoma rate shown is 31.2 blacks per million killed in Oklahoma versus 5.2 in Atlanta.
I downloaded the data from the site. It showed 40.0 in Oklahoma and 8.2 in Atlanta, probably because it was a different date from that posted on the website. That’s not the issue, though.
In the same database, the Oklahoma rate is 6.09 per million whites versus 0.93 in Atlanta.
So whites are six times more likely to be killed by police in Oklahoma than Georgia!
Why use those police departments?
Why not use Greensboro with 1.3 blacks per million killed by police versus Reno at 71.5?
The headline could be blacks are 55 times more likely to be killed by police in Reno than Greensboro!
Data scientists should avoid this kind of cherry-picking data comparison. They are the equivalent of using hemlines to predict the stock market.
For example, a cherry-picking data scientist might also compare Chicago and Laredo.
Using the same database we find 0.3 police killings of whites in Chicago compared with 17.7 in Laredo.
Whites are 59 times more likely to be killed by police in Laredo than Chicago.
What have we learned from this comparison?
Nothing!
These data points use the raw population, and if police killings were related to the total population that might make the comparison relevant.
If you have gotten this far, you probably think that you saw me compare police departments up above.
Why were those ok?
In my comparisons, one set was internally consistent—police killings of blacks in a jurisdiction versus police killings of all in the same jurisdiction.
The other set compares jurisdictions after normalizing by the violent crime rate of the jurisdiction.
Examples of dishonest visualizations and proper visualizations
Other charts not used in the discussion above, but relevant to the debate
